Instructions
Overview
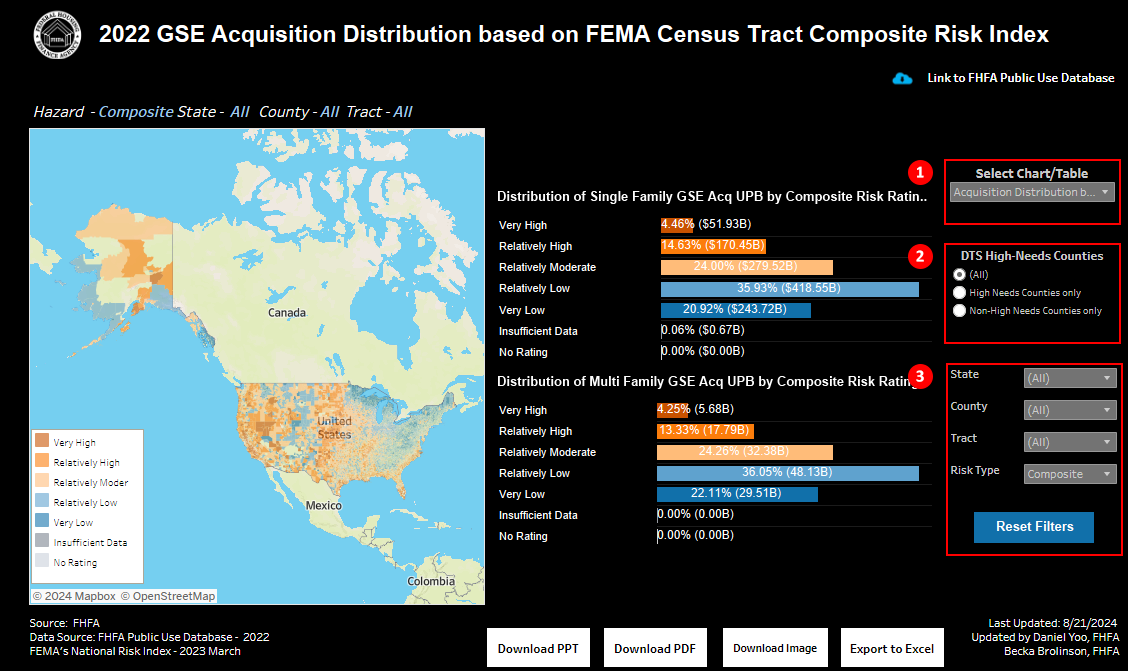
Figure 1: Dashboard Landing Page
The official name of the dashboard is the “Mortgage Loan and Natural Disaster Dashboard,” but throughout these FAQs we will refer to it as the “dashboard” for simplicity. The default settings of the dashboard show the nationwide map with the census-tract-level composite National Risk Index (NRI) Ratings. The filters are located on the dashboard's right side, allowing the user to navigate the map, charts, and tables in the dashboard.
The first filter box, "Select Chart/Table," will enable you to browse various information in the dashboard. The "Acquisition" option in the filter shows the loan acquisition counts and total acquisition unpaid principal balance (UPB) of the loans in selected communities acquired by FHFA’s regulated entities, both single-family and multifamily. The "National Risk Index" option shows census tract-level NRI indices and Expected Annual Losses from the selected hazard. It also provides state and national averages of NRI indices. The "Acquisition Distribution by Risk Rating" tab shows the distributions of acquisition UPB by the risk ratings for selected hazards. It provides nationwide distribution, as well as for the selected state, county, and census tract.
The filter box number 2, "Duty to Serve High Needs Area," allows users to keep only the Duty to Serve high needs areas or exclude them from their results.
The last filter box lets users change the geographic area. It applies to all the maps, tables, and charts in the dashboard. The dashboard shows the nationwide result when all the geographic filters are (all). Once a state is selected, the results will be state-level, once a county is selected, the results will be county-level, and once a tract is selected, the results will be tract-level. The dashboard provides information down to the census-tract level.
Acquisition Distribution by Risk Rating Tab
The Acquisition Distribution by Risk Rating Tab in the “Select Chart/Table” filter shows the total acquisition UPB distributed in each risk rating category. The first chart shows the Single-Family Acquisition UPB distribution, and the chart below shows the Multifamily Acquisition UPB distribution. Figure 1 shows the nationwide information by composite risk rating. Selecting communities and hazards in the filter box, number 3 in Figure 1, allows users to see the UPB distribution of a state, county, and census tract by 18 hazards.
National Risk Index Tab
The National Risk Index tab in the “Select Chart/Table” filter shows the census tract-level risk index for 18 hazards and composite risk. These represent census tract-level data, and no results will be shown unless a census tract is selected in the geographic filter area.
Once a state is selected in the “State” filter, the map will zoom to the state and the state averages will be populated. Once the “County” filter is selected, the map will zoom to the county. The table on the right-hand side of the map show the census tracts NRI indices for the selected hazard, the Social Vulnerability Index, and the Resilience Index. The first column of the circles shows the census tract’s index, the state average index in the second column, and the national average in the third. Below the colored circles are the census tract-level expected annual losses for composite risk and the selected hazard. To see total expected annual loss broken down into each hazard type for the selected census tract, hover over any of the “Expected Annual Loss Composite ($)” cells. The tab provides information on 18 hazards and composite risk, and users can select hazard in the “Risk Type” filter in the third filter box.
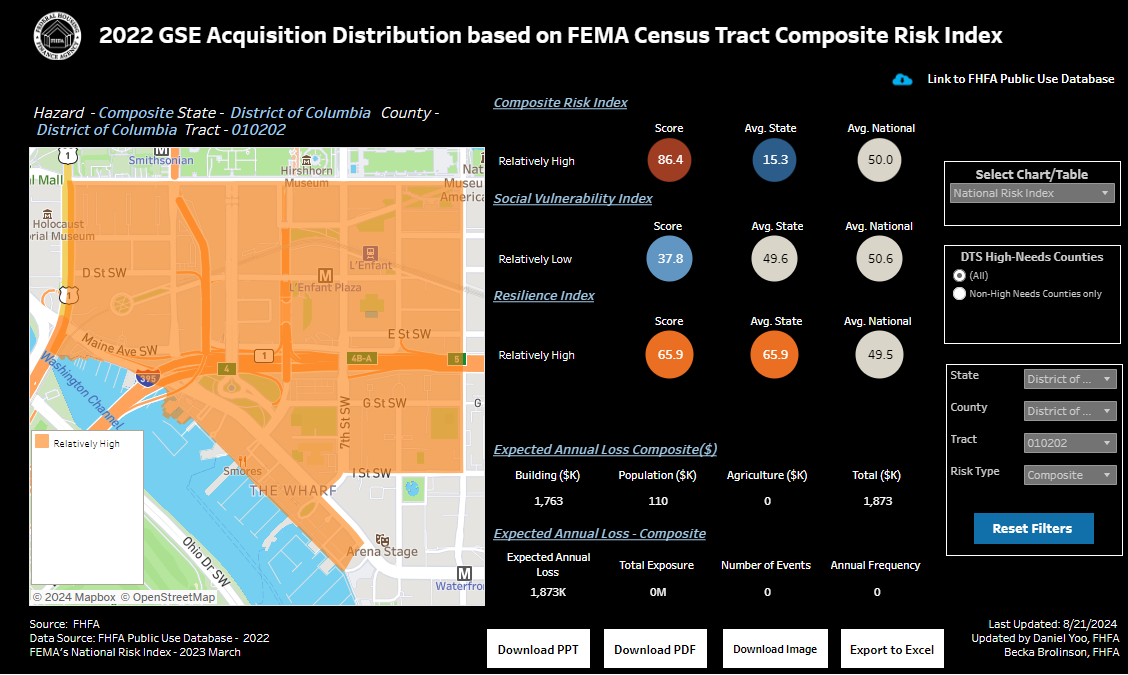
Figure 2: Example of National Risk Index Information for Composite Risk
Acquisition Tab
The Acquisition tab shows the counts and total acquisition UPB of the loans purchased by Fannie Mae, Freddie Mac, and the Federal Home Loan Banks (FHLBanks) in 2022. The geographic filters allow users to find the statistics for the communities in which they are interested. Once the filters are selected, the tab will show the information for the selected state, county, and census tract.
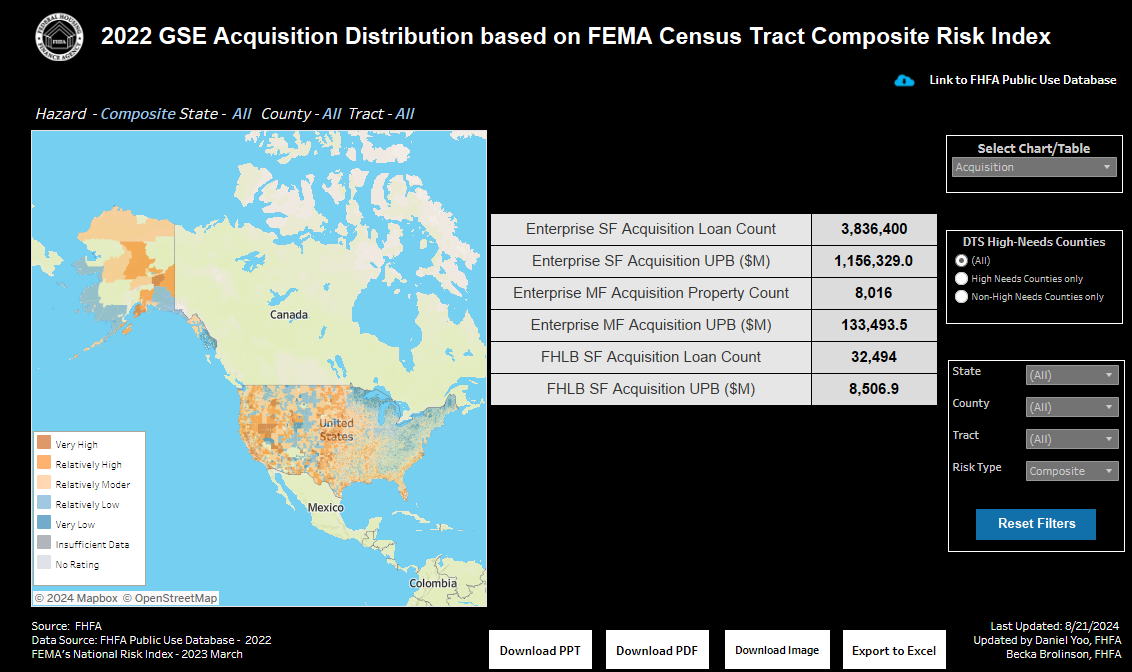
Figure 3: Acquisition Tab
Frequently Asked Questions
For questions regarding FEMA’s NRI data, please refer to the technical documentation here.
- Why are “National Risk Index” and “Expected Annual Loss” blank in the default setting?
- The National Risk Index Score and Expected Annual Loss (Figure 4, highlighted in red) are census tract-level data. It will be blank until a “State,” “County,” and “Tract” in the Filter section is selected (Figure 4, highlighted in yellow). The census-level information will be populated once a census tract is selected, as shown in Figure 5.
- The “Avg. State” represents an average of indices in the census tracts in a selected state and it will be populated once a State is selected.
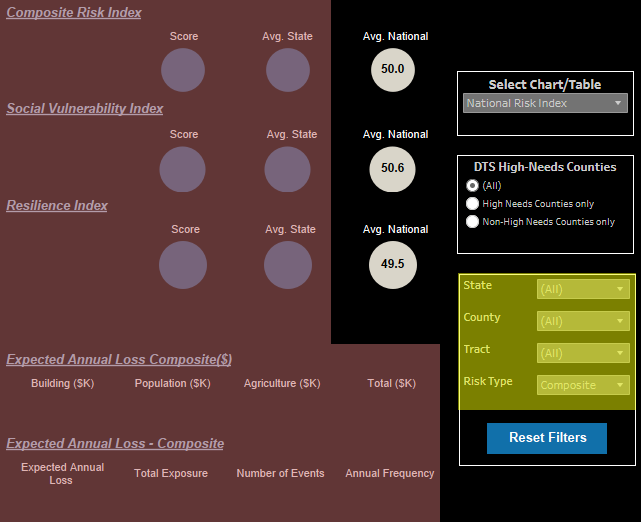
Figure 4: NRI and EAL
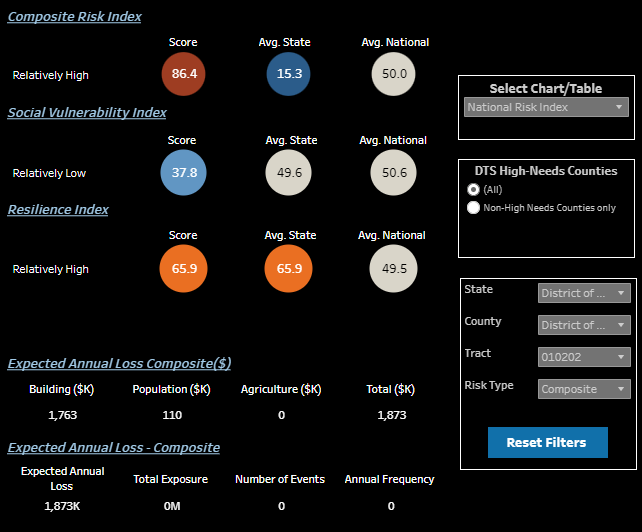
Figure 5: NRI and EAL Populated with Census-Tract Selection
- What information about natural hazard risk does the NRI provide?
- The NRI provides information about the relative risk of a hazard in a particular community. Because the hazard data is scaled to the national level, within a particular hazard the risks can be compared across communities, but it is more difficult to compare within a community across hazard types. For example, the 90th percentile risk of a hurricane will have different expected losses than the 90th percentile risk for a winter storm.
- How to select states or counties in the geographic filter area?
- The geographic filter is located in the last square box on the right-hand side of the dashboard (Figure 1, filter box number 3).
- To select single or multiple States or Counties
- Open the State or County filter drop-down menu and unselect (All). It nullifies the state/county, and the dashboard's content will disappear. Select State/County one by one, and it will generate the chart and tables for the selected area.
- To Select All States or Counties
- Open the State or County filter drop-down menu and select (All). To see all-state results, click "Reset Button."
- The map doesn’t move automatically when I select a geographic area in the filter.
- The Tableau map will be fixed when a user pans or zooms in the map. Unfix the map by clicking “Zoom Home” (Figure 6).
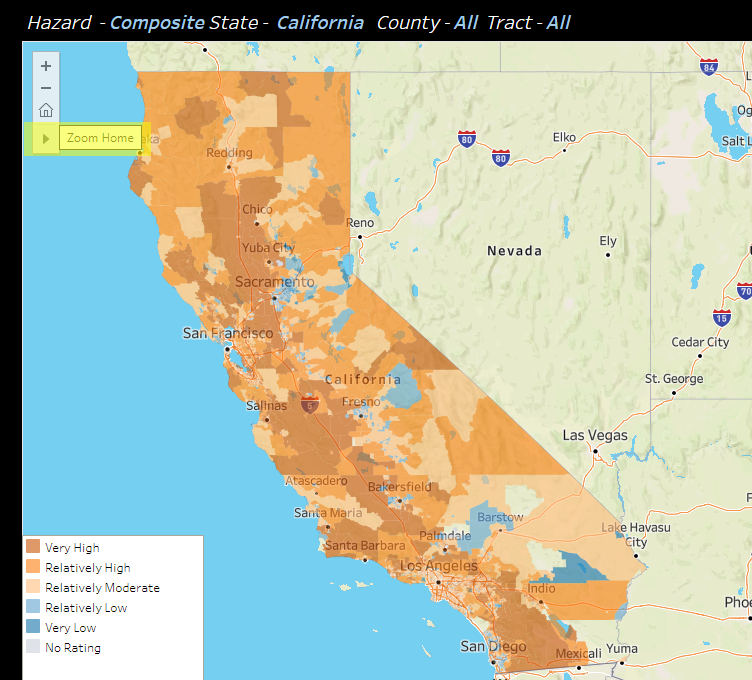
Figure 6: How to Unfix the Map
- What are Duty to Serve High-Needs Rural Areas?
- High-needs rural regions defined by FHFA[1] represent the following:
- “high-needs rural region” as any of the following regions provided the region is located in a “rural area”:
- Middle Appalachia;
- the Lower Mississippi Delta;
- a colonia census tract; or
- a tract located in a persistent poverty county and not included in Middle Appalachia, the Lower Mississippi Delta, or a colonia census tract.
- “high-needs rural region” as any of the following regions provided the region is located in a “rural area”:
- High-needs rural regions defined by FHFA[1] represent the following:
- The Duty to Serve High-Needs Area filter doesn’t give me any options.
- The “High-needs areas only” option is unavailable when there is no Duty to Serve High-Needs area in the selected map region. Likewise, the “Non-High-needs areas only” option is not available when there are only Duty to Serve High-Needs rural areas in the selected map region.
- What are the differences between Insufficient Data, No Rating, and Not Applicable in Risk Ratings?
- If a community is displayed in the application as having “No Expected Annual Loss” for the selected hazard type, the rating will show “No Rating” for its Risk Index for that hazard type. “No Rating” indicates that this community does not have any expected physical risk for the selected hazard type.
- If a factor used to calculate the Expected Annual Loss of a census tract or county for a hazard type has a null value, the community is rated as having “Insufficient Data.”
- The communities are displayed as “Not Applicable” if communities are located where no documented risk exists for the hazard type and where the hazard type is deemed not likely to occur.
- Please review page 36 of FEMA’s NRI Technical Document for more details.
- How can I export the results in the dashboard to the Excel or CSV file?
- To export the "Acquisition" Tab results, first click "Acquisition" in the "Select Chart/Table" filter and select other filters based on your interest. Then click "Export to Excel" and select "Acquisition." Select a format and click "Download."
- To export the "Acquisition Distribution by Risk Rating" Tab results, click "Acquisition Distribution by Risk Rating" in the "Select Chart/Table" filter and select other filters based on your interest. Then click "Export to Excel" and select "DIST-SF" to download Single-Family distribution. Select a format and click "Download." Click "Export to Excel" again and download "DIST-MF." Combine the two Excel files.
- To export the "National Risk Index" Tab results, click "National Risk Index" in the "Select Chart/Table" filter and select other filters based on your interest. Then click "Export to Excel" and select "NRI-1" to download Single-Family distribution. Select a format and click "Download." Do the same process for NRI-2 to NRI-5 as well and combine those.
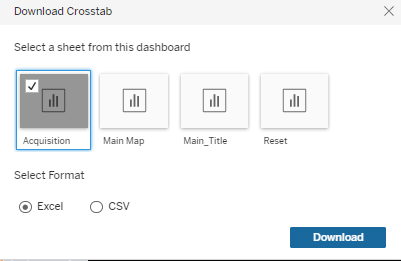
Figure 7: Export to Excel Example
- How can I download data embedded in the dashboard?
- To download the complete imported data underlying the dashboard, reset all the filters. Then, click an empty space on the map. Click the "Choose a format to download" button at the bottom of the dashboard (Figure 8). Click "Data." Make sure to click the map if the "Data" option is greyed out.
- To download aggregated PUDB data, go to "GSE_2022" in the "View Data" pop-up window and click "Download all rows as a text file." Please check Appendix I for the data dictionary for GSE_2022.
- To download NRI data, go to "NRI_CensusTacts" in the "View Data" pop-up window and click "Download all rows as a text file." Please check Appendix II for the data dictionary for NRI_CensusTacts.
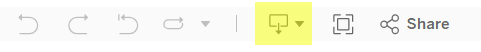
Figure 8: Choose a format to download button
Appendix I: Data Dictionary - GSE_2022
| Field Name | Field Description |
|---|---|
| State | State Name |
| County | County Name |
| Tract | 2020 Census Tract |
| Tractfips | State-County-Tract FIPS Code |
| Stcofips | State-County FIPS Code |
| Ym | Acquisition Year |
| pov_ind | Persistent Poverty County Indicator |
| Risk_Rating_S | National Risk Index Rating for selected Hazard |
| rural_ind | Rural area for purposes of Duty to Serve Indicator |
| Gsel | SF Loan Count - Purchased by Enterprise |
| Gsemfl | MF Property Count - Purchased by Enterprise |
| Gseu | Total SF Acquisition UPB - Purchased by Enterprise |
| Gsemfu | Total MF Acquisition UPB - Purchased by Enterprise |
| Hlbl | SF Loan Count - Purchased by FHLBanks |
| Hlbu | Total SF Acquisition UPB - Purchased by FHLBanks |
Appendix II: Data Dictionary - NRI_Census_Tracts
| Field Name | Field Description |
|---|---|
| State | State Name |
| County | County Name |
| Tract | 2020 Census Tract |
| Stcofips | State-County-Tract FIPS Code |
| Tractfips | State-County FIPS Code |
| pov_ind | Persistent Poverty County Indicator |
| Risk_Rating_S | National Risk Index Rating for selected Hazard |
| rural_ind | Rural area for purposes of Duty to Serve Indicator |
| Avln Riskr | Hazard Type Risk Index Rating - Avalanche |
| Cfld Riskr | Hazard Type Risk Index Rating - Coastal Flooding |
| Cwav Riskr | Hazard Type Risk Index Rating - Cold Wave |
| Drgt Riskr | Hazard Type Risk Index Rating - Drought |
| Erqk Riskr | Hazard Type Risk Index Rating - Earthquake |
| Hail Riskr | Hazard Type Risk Index Rating - Hail |
| Hwav Riskr | Hazard Type Risk Index Rating - Heat Wave |
| Hrcn Riskr | Hazard Type Risk Index Rating - Hurricane |
| Istm Riskr | Hazard Type Risk Index Rating - Ice Storm |
| Lnds Riskr | Hazard Type Risk Index Rating - Landslide |
| Ltng Riskr | Hazard Type Risk Index Rating - Lightning |
| Rfld Riskr | Hazard Type Risk Index Rating - Riverine Flooding |
| Swnd Riskr | Hazard Type Risk Index Rating - Strong Wind |
| Trnd Riskr | Hazard Type Risk Index Rating - Tornado |
| Tsun Riskr | Hazard Type Risk Index Rating - Tsunami |
| Vlcn Riskr | Hazard Type Risk Index Rating - Volcanic Activity |
| Wfir Riskr | Hazard Type Risk Index Rating - Wildfire |
| Wntw Riskr | Hazard Type Risk Index Rating - Winter Weather |
| Risk Ratng | Hazard Type Risk Index Rating - Composite |
| Resl Ratng | Community Resilience - Rating |
| Sovi Ratng | Social Vulnerability - Score |
[1] Please see the link here for more information about FHFA’s Duty to Serve High-Needs Rural areas.