Introduction
On October 24, 2022, the Federal Housing Finance Agency (FHFA) released the Uniform Appraisal Dataset (UAD) Aggregate Statistics Data File and Dashboards. This marked the first time borrower data (with privacy protections) on appraisal reports for Enterprise single-family properties were available publicly. Through these new statical products, users may analyze data and create visualizations to explore broad trends in appraisals by property or neighborhood characteristics at various levels of geography.
In this blog post, we focus on our recently released UAD Aggregate Statistics Top 100 Metro Areas Dashboard to analyze the changes in appraisal values in the third quarter of 2022, both on a year-over-year and quarterly basis. This new dashboard ranks the top 100 metropolitan areas by year-over-year percent changes in appraisal values. It also provides unranked quarterly percent changes for each metropolitan area. The UAD Aggregate Statistics Top 100 Metro Areas Dashboard is important because it provides a comprehensive yet concise view of the differences in appraisal value trends across the most populated areas of the country.
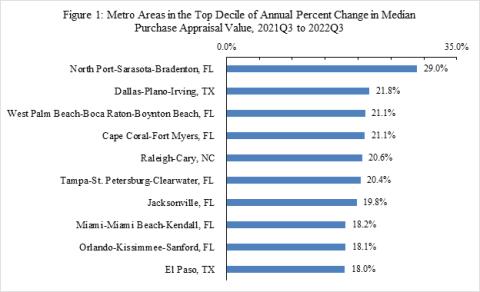
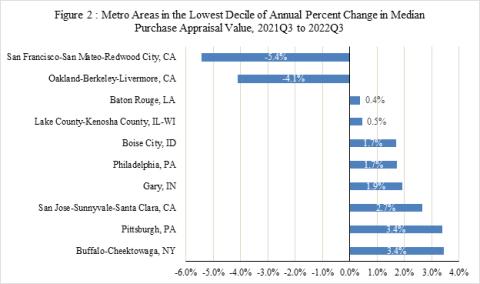
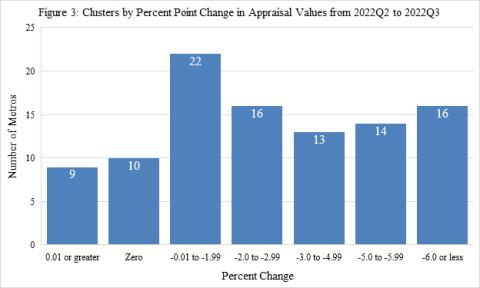
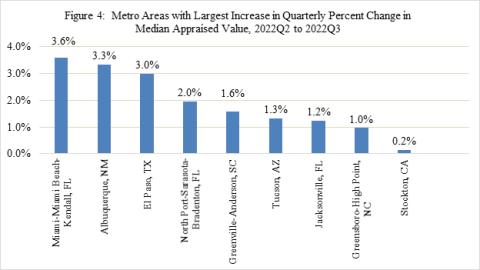
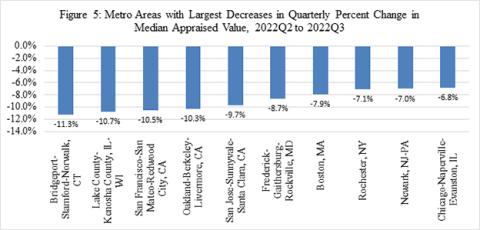
Our analysis of the Dashboard data indicates that median appraisal values were higher than a year ago in most metro areas, with many even witnessing double-digit growth. However, between the second and third quarter of 2022, appraisal values declined in 81 of the 100 metro areas, with only nine experiencing very modest growth.
Annual Percent Change in Median Appraisal Values (2021Q3 to 2022Q3)
Quarterly Percent Change in Median Appraised Values (2022Q2 to 2022Q3)
Summary
The Top 100 Metro Areas Dashboard is a user-friendly tool providing information on home valuation changes. The dashboard allows users to access information on annual and quarterly changes in median appraisal values. In this blog, we use data in the new dashboard to show which metropolitan areas are reporting both gains and decreases in median appraisal values annually (2021Q3 to 2022Q3) and quarterly (2022Q2 to 2022Q3).
FHFA is a trusted and leading source of housing finance data. The UAD Aggregate Statistics and new Top 100 Metro Areas Dashboard exemplifies FHFA’s commitment to increasing market transparency.
If you have any questions or comments about the FHFA UAD Aggregate Statistics Data File or Dashboards, please email Statistical_Products@fhfa.gov.
Tagged: FHFA Stats Blog; Aggregate Statistics; Appraisals; Data; Data Dashboards; Open Data; Source: FHFA; Uniform Residential Appraisal Report (URAR)
By: Diego Saltes
Senior Statistician, Statistical Products Branch
Office of the Chief Data Officer
Division of Research and Statistics
By: Rashida Dorsey-Johnson
Branch Chief, Statistical Products
Office of the Chief Data Officer
Division of Research and Statistics