FHFA analysis shows higher relative growth in the median appraised value for Enterprise-backed single-family properties with accessory dwelling units than for those without accessory dwelling units in the state of California between 2013 and 2023.
UAD Aggregate Statistics
The Federal Housing Finance Agency (FHFA) is a trusted and leading source of housing finance data. Its Uniform Appraisal Dataset (UAD) Aggregate Statistics offers insights into housing trends and market conditions and presents appraisal data that may be grouped by property, site, and neighborhood characteristics, as well as geographic levels.[1] In 2023, FHFA added accessory dwelling unit (ADU) data to the UAD Aggregate Statistics. This blog presents trends in the ADU property characteristic (Accessory Dwelling Unit Present) for single-family appraisals on loans backed by Fannie Mae or Freddie Mac (the Enterprises) for properties in California.[2]
What are ADUs?
ADUs are smaller, independent residential units on the same lot as a stand-alone single-family home. They must provide living, sleeping, cooking, and bathroom facilities.[3] Structurally, they can be basement apartments, dwelling units above a garage, or small stand-alone structures that are either attached or detached from the primary home. Zoning or other state and local policies generally dictate the types of ADU permissible structures.
ADUs offer many benefits for homebuyers and renters. Economically, they allow homeowners to earn rental income to offset mortgage and maintenance costs, as well as empower them to make decisions about land they already own.[4] Additionally, ADUs increase the housing stock without the need for new land, which can help promote the availability of affordable rental options.[5] Socially, they can enhance multigenerational living arrangements, allowing families to stay close while maintaining privacy and supporting aging relatives.[6]
However, ADU development also faces challenges, including varied and sometimes restrictive local zoning laws that can limit construction,[7] such as owner-occupancy requirements and parking mandates.[8] High construction costs and limited financing options impose significant barriers to ADUs, as well.[9] Recognizing these ADU benefits and challenges, several states have revised zoning laws to facilitate more accessible construction.
ADU Landscape in California
California has led efforts to expand access to, and availability of, ADUs. In 2016, policymakers began implementing statewide legislation to streamline approvals and reduce barriers to ADU construction, such as banning minimum lot sizes, eliminating impact fees[10] for smaller ADUs, and limiting owner-occupancy requirements.[11] Additionally, California established an ADU grant program[12] that has further incentivized homeowners to build ADUs by reimbursing development costs[13] and non-recurring closing costs.[14] The robust demand exhausted the grant program’s allocated fund within a few days.[15] Such policies reflect a growing recognition that ADUs may alleviate housing shortages and make housing more affordable in high-demand areas.
What Does the Data Show?
The dataset represents purchase loan appraisals for single-family properties submitted to the Enterprises from 2013 to 2023. The data on ADU appraisals is limited, as the growing number of homeowners adding ADUs to their properties drives this emerging field. In this blog, we examine trends in two key statistics – appraisal counts and median appraised values – for Enterprise-backed single-family purchase properties with ADUs. Because prices rose through this period for both properties with and without ADUs, we focus on comparing the median appraised value growth for both in California.
Appraisal Count for Enterprise-Backed Single-Family Property Purchase Loans
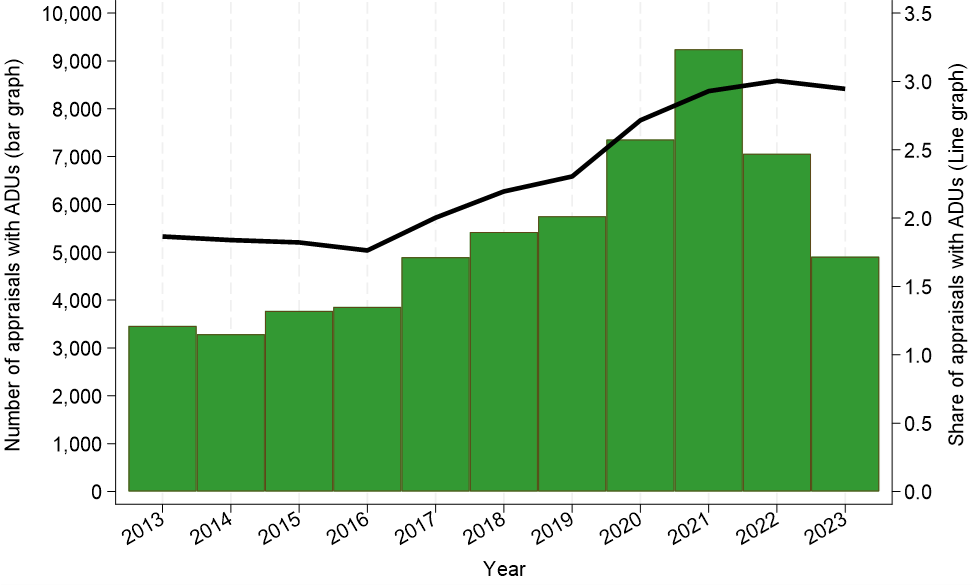
The number of purchase appraisals with ADUs increased from 3,463 in 2013 to 4,910 in 2023. However, the number of appraisals with ADUs dropped from its peak of 9,246 in 2021 (see Figure 1). This decline since 2021 reflects a broader decline in mortgage market volume in 2022 and 2023. The share of appraisals with ADUs in total appraisals has been increasing since 2016 (see Figure 1). The share of appraisals with ADUs was 1.9 percent in 2013 and this share declined to 1.8 percent by 2016. However, since 2016, the share increased by nearly 60 percent to reach 3.0 percent in 2022 and 2.9 percent in 2023.[16] The increase in the number and the share of property appraisals with ADUs potentially reflects market reaction to the efforts by policymakers in California to implement statewide legislation to streamline approvals and reduce barriers to ADU construction.
Figure 1: Number and Share of Appraisals with ADUs for Enterprise-Backed Single-Family Purchase Loans in California, 2013-2023

Source: FHFA. Uniform Appraisal Dataset Aggregate Statistics
Median Appraised Value for Enterprise-Backed Single-Family Property Purchase Loans
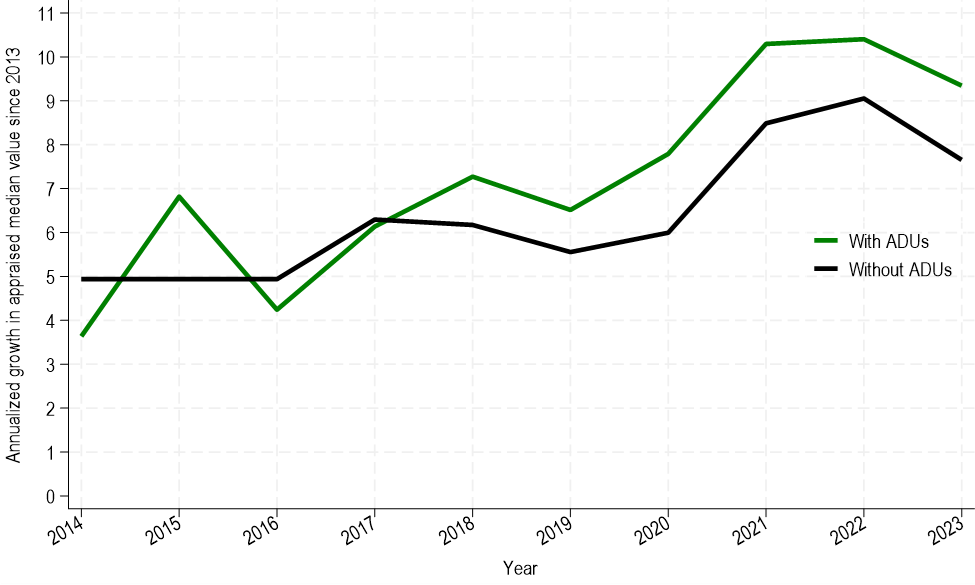
The median appraised value, in 2013, was $550,000 for properties with ADUs and $405,000 for properties without ADUs in California. By 2023, the median appraised value increased to $1,064,000 and $715,000 for properties with and without ADUs, respectively. While California saw the appraised median value for properties without ADUs record annualized growth of 7.65 percent from 2013 to 2023, the annualized growth was 9.34 percent for those with ADUs.[17] From Figure 2, we can see that the annualized growth in the median appraised values for properties with ADUs has been higher than for properties without ADUs since 2018. While higher annualized growth in the median appraised value for properties with ADUs requires further analysis, one potential explanation could be the development of larger and higher-quality ADUs after 2018 because of California’s ADU grant program reimbursing ADU development costs.
Figure 2: Annualized Growth in the Median Appraised Value in Properties with and without ADUs in California since 2013 
Source: FHFA. Uniform Appraisal Dataset Aggregate Statistics
Conclusion
The Enterprise Single-Family UAD Aggregate Statistics Datafile and Dashboards is one of the few publicly available datasets that provides data on ADUs. When looking at the growth in the median appraised value, we observed that the growth was much stronger for properties with ADUs as compared to those without ADUs in California since 2013. To investigate this trend further, researchers could explore data at the metropolitan level.
According to industry and advocacy groups, affordable housing shortages exist in many high-cost housing areas across the United States, including California.[18] California has one of the highest median appraised values for single-family properties in the United States.[19] ADUs present an opportunity for expanding affordable housing options, particularly in urban areas. California may offer valuable lessons for other parts of the United States grappling with housing shortages, such as the benefits associated with providing incentives through state and local programs or reducing barriers to entry. Such measures can alleviate housing shortages and increase property values. To explore this data further, researchers could examine how market dynamics influence appraised values for properties with ADUs, how permissive zoning for ADUs might affect prices, and whether properties with ADUs tend to have larger lots or specific layouts. Additionally, in implementing policies to encourage the construction of ADUs, states and jurisdictions need to consider other factors, such as additional infrastructure needs, increased property maintenance costs, and landlord education. As cities refine their housing policies, these lessons may influence future approaches to ADU integration and development across the nation and potentially beyond.
[1] FHFA derives UAD Aggregate Statistics from aggregating UAD appraisal records. The UAD is a standardized industry dataset for appraisal information that Fannie Mae and Freddie Mac receive electronically through the Uniform Collateral Data Portal© (UCDP©). The UAD Aggregate Statistics data universe is comprised of single-family properties appraised using Fannie Mae Form 1004/Freddie Mac Form 70 and condominiums appraised using Fannie Mae Form 1073/Freddie Mac Form 465. We exclude manufactured homes, small multifamily rental properties, and other non-standard appraisals. The universe includes properties appraised for the purposes of a sale or refinance. We exclude other types of appraisals, such as construction loan appraisals. We include appraisals for properties in the 50 U.S. states, the District of Columbia, and Puerto Rico, and exclude the U.S. Virgin Islands and Guam. For more information, please refer to the UAD Aggregate Statistics Data File Overview document.
[2] Accessory dwelling unit (ADU) data may contain appraiser data entry errors. Some properties may be reported as having an ADU but, in fact, do not. In contrast, some properties may have an ADU but were not reported as such.
[3] See: Fannie Mae Selling Guide - Special Property Eligibility Considerations | Fannie Mae and Freddie Mac Selling Guide - Guide Section 5601.2
[5] See: https://ternercenter.berkeley.edu/wp-content/uploads/2022/08/ADU-Equity-August-2022-Final.pdf
[8] Ibid.
[10] Impact fees are one-time payments that cover the cost of additional infrastructure and public services.
[11] Laws SB 9, AB 671, AB 68, SB 13, and AB 1033 are referenced. In 2018, California permitted approximately 9,000 ADUs. In 2023, Los Angeles County alone permitted more than 45,000 ADUs. See: https://www.brookings.edu/articles/californias-decade-long-effort-to-legalize-adus-offers-lessons-for-other-us-states-and-regions/
[12] See: https://www.calhfa.ca.gov/adu
[13] Creation costs include site prep, architectural designs, permits, soil tests, impact fees, property surveys, and energy reports.
[14] Non-recurring closing costs include title insurance, escrow fee, appraisal fee, underwriting fee, notary fee, recording fee, and transfer taxes.
[16] The trend at the national level was similar to that observed in California. However, at the national level, the share increased from 0.9 percent in 2013 to 1.2 percent in 2023. This is a relatively smaller 36 percent increase as compared to the 58 percent increase in California.
[17] The trend at the national level was similar to that observed in California. At the national level, the appraised median value recorded an annualized growth of 7.20 percent and 6.25 percent for properties with and without ADUs from 2013 to 2023, respectively.
[19] UAD Aggregate Statistics
Authors:
Stephanie Boateng
Statistical Products Branch
Office of the Chief Data Officer
Division of Research and Statistics
Rashida Dorsey-Johnson
Branch Chief, Statistical Products
Office of the Chief Data Officer
Division of Research and Statistics