Interest rates hit historic lows in 2020-2021 and prompted substantial refinancing of mortgage loans before rates surged back up in 2022. Many mortgage borrowers now have fixed-rate loans significantly below current market interest rates, creating a strong disincentive to sell. This phenomenon, known as the “lock-in” effect, is the focus of a recent FHFA working paper, which has been recently revised. The paper quantifies the extent of lock-in exposure, estimates the sensitivity of sales to lock-in, and reveals how this supply restriction is exerting upward pressure on home prices. Using the most currently available data through the second quarter of 2024, we have updated the accompanying datasets that allow users to delve into lock-in metrics across borrower characteristics, loan/property characteristics, and geographies. This blog post zeroes in on the geography of the lock-in effect, revealing which large Metropolitan Statistical Areas (MSAs) are most locked-in.[1]
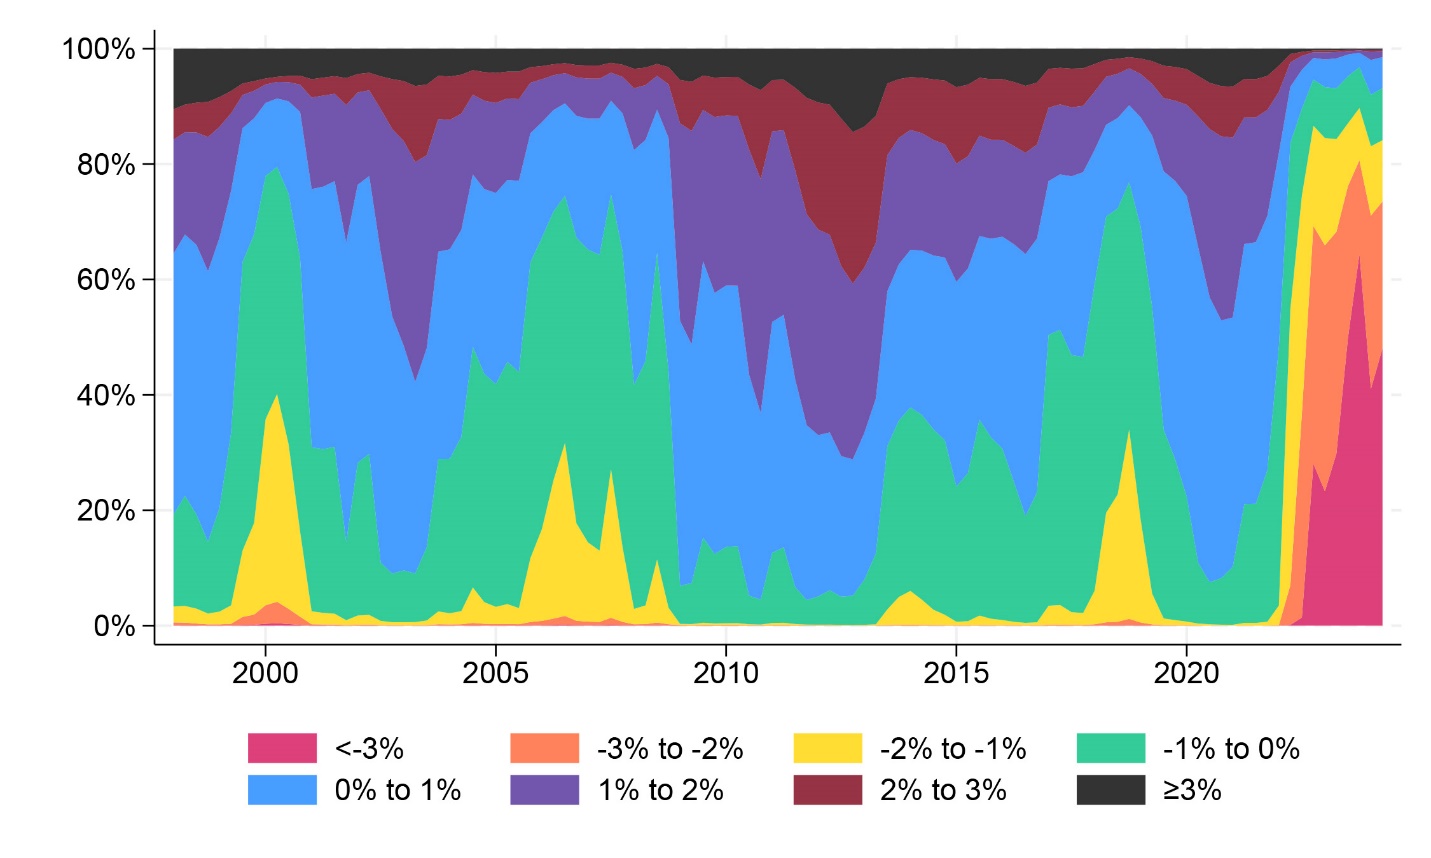
As of 2024Q2, the average rate delta was -2.54, indicating that the average loan has a fixed rate that is 2.54 percentage points lower than the current market rate for similar loans. This difference has slightly decreased since 2023Q4, when it was over three percentage points. This level of lock-in is unprecedented in recent history. As shown in Figure 1, the rise in warmer colors after 2020 indicates the vast majority of loans have a negative rate delta. The last quarter century has never experienced such a sharp and pervasive increase in mortgage rate lock-in.
Figure 1: Rate Delta Distribution Over Time
How does lock-in exposure differ across cities? Mortgage rates are similar nationwide, and the differences that do exist tend to be stable over time. Consequently, all cities will have similar exposure with minor differences resulting from variations in origination timing. Table 1 shows the top five MSAs with the highest exposure are all in California and represent areas with 1) more borrowers refinancing in 2020-2021 and 2) fewer new purchasers since 2022.
Table 1: MSAs With Highest Lock-In Exposure
| MSA | Avg. Rate Delta |
|---|---|
| San Jose-Sunnyvale-Santa Clara, CA | -3.01 |
| San Francisco-Oakland-Fremont, CA | -2.93 |
| Oxnard-Thousand Oaks-Ventura, CA | -2.93 |
| San Diego-Chula Vista-Carlsbad, CA | -2.91 |
| San Luis Obispo-Paso Robles, CA | -2.90 |
The paper found that, on average, every percentage point of lock-in decreases the probability of sale by 18.1%. However, some types of borrowers are more sensitive than others. For example, affluent borrowers, particularly those in high-value homes, have higher sensitivity. This may reflect that lock-in can remove the incentive to downsize or make other moves that generally would save money. Moving to a smaller home or a jurisdiction with lower taxes may not lower monthly expenses if the new mortgage has a much higher interest rate. The paper also finds that, controlling for affluence, non-white borrowers are more sensitive to lock-in. Table 2 ranks the MSAs by sensitivity to show the top places have high home values, high minority populations, or both.
Table 2: MSAs With Highest Lock-In Sensitivity
| MSA | Sale Sensitivity to Rate Dela |
|---|---|
| Rockford, IL | 27.1% |
| Oxnard-Thousand Oaks-Ventura, CA | 26.8% |
| Los Angeles-Long Beach-Anaheim, CA | 26.4% |
| San Jose-Sunnyvale-Santa Clara, CA | 25.6% |
| Provo-Orem-Lehi, UT | 25.3% |
The paper estimates that the lock-in effect prevented 1.72 million fewer sales between 2022Q2 and 2024Q2. This supply restriction has increased home prices by an estimated 7.0%, counteracting the direct effect of higher interest rates, which decreased prices by an estimated 5.6%. The number of lost sales is the product of the exposure to lock-in, the sensitivity to lock-in, and the number of outstanding fixed-rate mortgages. This last factor will be influenced by the size of the MSA, the homeownership rate, and the number of owners who own outright (without a mortgage) or with an adjustable-rate mortgage. The five MSAs with the most lost sales are all in the top ten MSAs by population. However, Chicago (#3 by population) and Houston (#5) do not make the list, while Phoenix (#10) does due to differences in lock-in sensitivity and mortgaged homeownership rates.
Table 3: MSAs With the Most Lost Sales
| MSA | Lost Sales Since 2022Q2 |
|---|---|
| New York-Newark-Jersey City, NY-NJ | -67,160 |
| Los Angeles-Long Beach-Anaheim, CA | -63,440 |
| Washington-Arlington-Alexandria, DC-VA-MD-WV | -51,730 |
| Dallas-Fort Worth-Arlington, TX | -50,970 |
| Phoenix-Mesa-Chandler, AZ | -48,920 |
Geography is a single dimension of mortgage rate lock-in. Readers may want to explore the datasets that offer cuts across other characteristics like loan type, home value, borrower income, and more. The paper provides timely insights and explains how financial lock-in has affected household decisions.
[1] This analysis is restricted to the 150 largest MSAs based on home sales activity.
By: Jonah Coste
Economist
Division of Research and Statistics
Tagged: Research; FHFA Stats Blog; Source: FHFA; Mortgage Debt