The COVID-19 Pandemic Migration (the Migration) led to a decline in state-level acquisition shares of manufactured housing mortgages on the West Coast and increasing shares in the Sun Belt states. This blog demonstrates how financing from the Enterprises enabled a practical solution for lower-income borrowers during the affordability crisis.
Introduction
The “COVID-19 Pandemic Migration” accelerated the trend of population migration especially from states on the west coast and in northeast to the Sun Belt region.[1] In this blog, we study how these patterns intertwine with manufactured home (MH) loans, focusing on support from the Enterprises.[2]
MHs cost significantly less than site-built homes and can be one solution to the current housing affordability crisis for lower-income borrowers.[3] The Enterprises have a statutory mandate to support MH purchases through their Duty to Serve plans.[4] From 2020 to 2023, over 60 percent of Enterprise MH loan acquisitions were on the West Coast (California, Oregon, Washington) and in the Sun Belt region (Alabama, Arizona, Florida, Georgia, North Carolina, Nevada, South Carolina, Tennessee, Texas). In 2023, the Enterprises began acquiring loans on single-wide (single-section)[5] homes to further help lower-income borrowers. Additionally, the Enterprises provide liquidity to manufactured housing communities with certain tenant pad-lease protections.[6] For this analysis, we focus only on single-family MH loans.
The COVID-19 Pandemic Migration
Using the Census Population Vintage 2023 data, we summarized U.S. net migration patterns between April 2020 and July 2023.[7] As shown in Exhibit 1, states that experienced the largest net out-migration are concentrated on the West, Northeast, and Illinois in the Midwest. Conversely, states in the Sun Belt region including Alabama, Arizona, Florida, Georgia, North Carolina, South Carolina, Tennessee, and Texas experienced significant population growth driven by net in-migration.
Exhibit 1: The COVID-19 Pandemic Migration, by County
(April 2020 to July 2023)
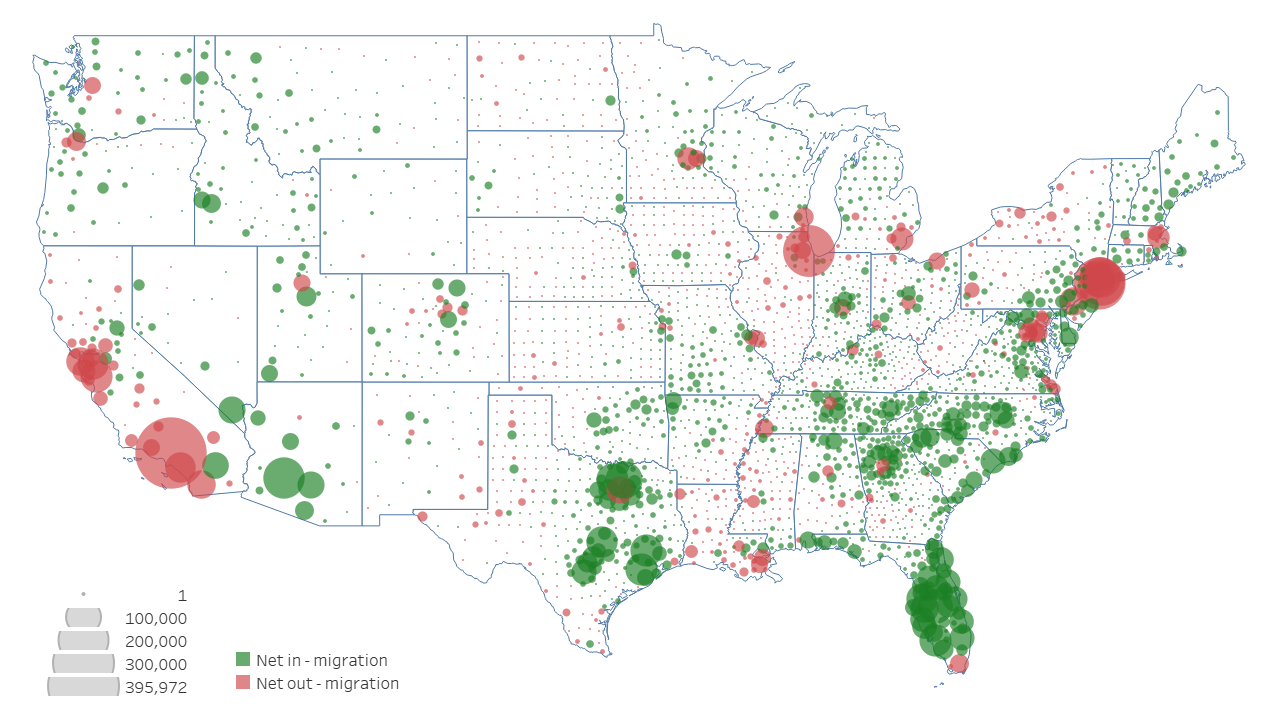
Source: U.S. Census Bureau, Population Vintage 2023 data, county-level detail.
Exhibit 2 highlights states with net in- or out-migration population exceeding 100,000 people. Among the Sun Belt states, Florida (1,168,000), Texas (947,000), North Carolina (376,000), South Carolina (272,000), Arizona (270,000), and Georgia (254,000) stand out as the most prominent net in-migration states. Meanwhile, California (‑875,000) and New York (-701,000) are the two largest net out-migration states.
Exhibit 2: States with the Largest Net In- and Out-Migration between April 2020 and July 2023
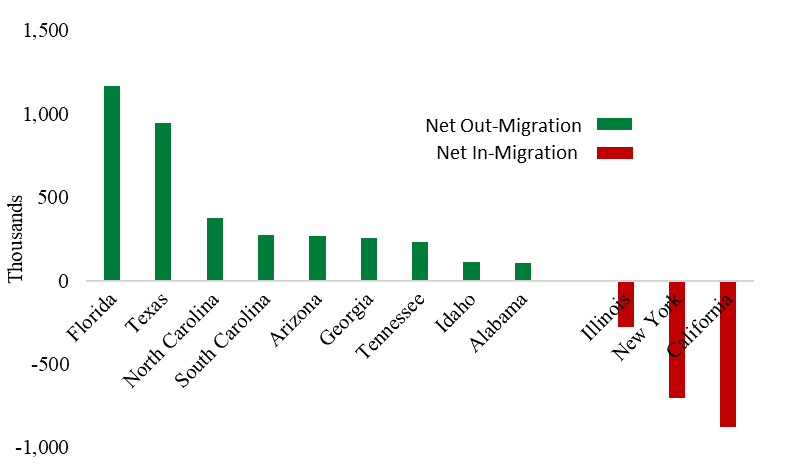
Source: U.S. Census Bureau, Population Vintage 2023 data
Housing cost played a central role in the Migration. The flexibility of remote work enabled many people to move from high-cost states like California and New York to more affordable Sun Belt states with larger living spaces. The CoreLogic Owner Transfer Data provides comprehensive coverage of property sales throughout the country.[8] Using that data, we derive median sales prices by state and transaction year. Exhibits 3a and 3b illustrate that, in 2020, the median sales price in the eight Sun Belt states were between 36 (Alabama) and 56 (Arizona) percent of the median sales price in California, and between 27 (Alabama) and 78 (Texas) percent of that in New York. With rapid home price appreciations in 2021 and 2022, the 2023 median sales prices in the eight Sun Belt states were 33 (Alabama) to 92 (Arizona) percent of that in California, and 24 (Alabama) to 100 (Arizona) percent of that in New York. Arizona saw the greatest increase in median sales price ratios among the eight Sun Belt states during this time.
Exhibit 3a: Median Sales Price Ratio in 2020
Sun Belt States vs. California and New York
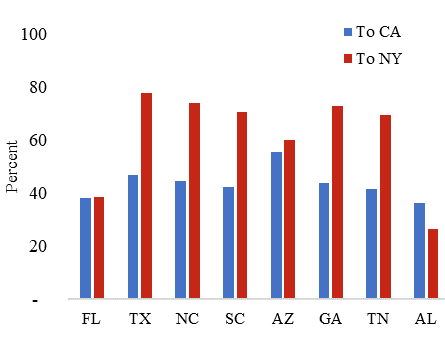
Exhibit 3b: Median Sales Price Ratio in 2023
Sun Belt States vs. California and New York
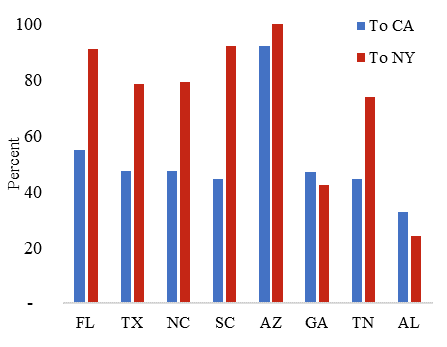
Sources: FHFA, CoreLogic
Enterprise Manufactured Home Loan Acquisitions
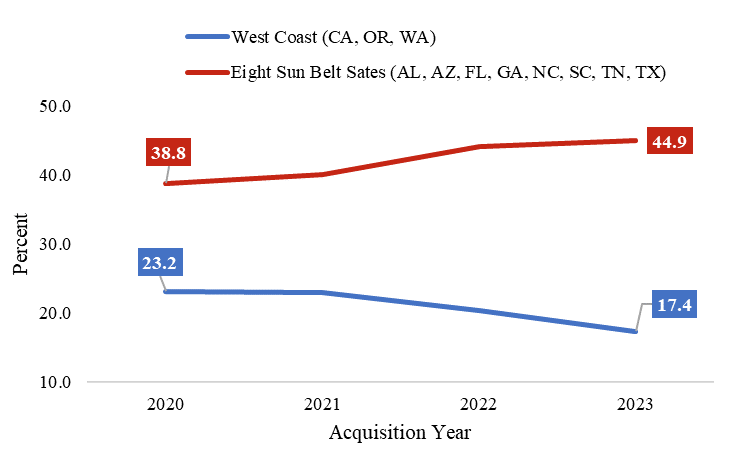
Exhibit 4 shows how regional patterns of Enterprise MH loan acquisitions followed population migration patterns from the West Coast to the eight Sun Belt states (Exhibit 2), with an acceleration in 2022 and 2023. From 2020 to 2023, the aggregate share of acquisitions in those states increased from 38.8 to 44.9 percent, while the share decreased from 23.2 to 17.4 percent on the West Coast.
Exhibit 4: Enterprise Manufactured Home Loan Acquisitions by Region
Source: FHFA
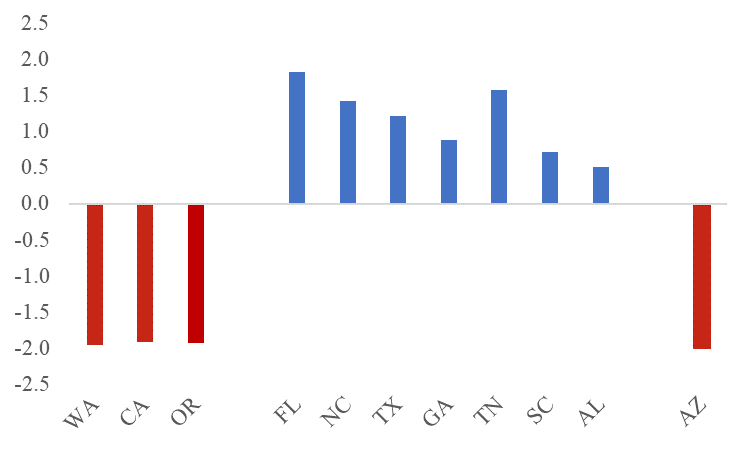
Exhibit 5 breaks down the information in Exhibit 4 to illustrate changes in state-level MH acquisition shares between 2020 and 2023. With Arizona as an exception, Enterprise activity in MH was generally aligned with broader migration trends. The shares for the three West Coast states (Washington, California, and Oregon) declined by nearly 2 percent, while shares in the Sun Belt states (excluding Arizona) increased from 0.5 to 2.0 percent. This pattern underscores the Enterprises’ role in facilitating population mobility during the period marked by an affordability crisis.
Exhibit 5: Change of State-Level Acquisition Shares: Between 2020 and 2023
Source: FHFA, Purchase Loans
A closer look of the market shares between the Enterprises and Ginnie Mae reveals that, between 2020-2023, Ginnie Mae held a greater market share in Arizona than the Enterprises (Exhibit 6a), explaining the 2 percent decline in the Enterprises’ market share in the state. Furthermore, Exhibit 6b shows that Ginnie Mae also commanded a higher market share for site-built[9] homes during this period.
Exhibit 6a: MH Mortgage Originations
Shares in Arizona: Enterprises vs. Ginnie Mae
| Origination Year | Enterprises | Ginnie Mae |
|---|---|---|
| 2020 | 56.2 | 43.8 |
| 2021 | 55.7 | 44.3 |
| 2022 | 51.2 | 48.8 |
| 2023 | 48.0 | 52.0 |
Exhibit 6b: Site-Built Mortgage Originations
Shares in Arizona: Enterprises vs. Ginnie Mae
| Origination Year | Enterprises | Ginnie Mae |
|---|---|---|
| 2020 | 76.5 | 23.6 |
| 2021 | 80.1 | 19.9 |
| 2022 | 78.3 | 21.7 |
| 2023 | 70.1 | 29.9 |
Source: HMDA
Conclusion
Population mobility across all income levels is vital for supporting a transforming economy. Our analysis indicates that the Enterprises activity in the manufactured housing market largely aligned with migration patterns from 2020 to 2023. During this time, the Enterprises supported manufactured housing as a viable solution for lower-income borrowers amid the affordability crisis.
[2] Fannie Mae and Freddie Mac
[4] For the discussion of Enterprise manufactured home loan acquisitions under Duty to Serve, see, https://www.fhfa.gov/blog/statistics/fannie-mae-and-freddie-mac-support-manufactured-housing.
[5] A single wide home, or single section home, is a floor plan with one long section rather than multiple sections joined together.
[6] https://www.fhfa.gov/sites/default/files/2023-12/DTS-Questions-and-Answers-v2023-2.pdf
[7] Net migration is the difference between people moving in to and moving out of a geographic area (census tract, county, state, etc.), excluding births and deaths. See, https://www.census.gov/data/tables/time-series/demo/popest/2020s-counties-total.html
[8] https://www.fhfa.gov/blog/insights/the-dynamics-of-fhfa-conforming-loan-limits-and-house-prices#_edn10
[9] Site-built homes include single-family detached, cooperative, condominiums, planned unit development, townhomes and cooperative.
By: Fan Xu
Senior Financial Analyst
Division of Research and Statistics