Measuring housing consumption cost is challenging because homeowners (about two thirds of U.S. households) do not face an explicit price for housing in their consumption bundle.[1] To measure housing consumption cost, the Consumer Price Index (CPI) calculates Owners’ Equivalent Rent (OER) using questions from the Bureau of Labor Statistics’ Consumer Expenditure Survey and the CPI Housing Survey.[2] OER is designed to measure housing consumption inclusive of all related costs.[3] However, many economists highlight limitations of this approach and advocate complementing it with a direct measure of housing cost based on the observed out-of-pocket outlay required to remain in a home.[4] For the 61 percent of homeowners with a mortgage, this outlay takes the form of a required monthly mortgage payment.[5]
The National Mortgage Database (NMDB®), the sole nationally representative database of U.S. mortgages, provides timely high-quality data reported from servicers on required mortgage payments. About 80 percent of these payments include escrow for property taxes and homeowners’ insurance, the main non-mortgage outlays.[6] This blog describes trends in required monthly payments using the NMDB to provide insights into how outlays have been changing for mortgage-holders, both those who have obtained a new mortgage recently and those who have not. The latter group comprises homeowners for whom changes in payments do not directly reflect a choice they made for a new purchase or refinance. The required payment measure is distinct from OER both conceptually and methodologically, so these measures may not be directly comparable. Instead, information about required payments supplements OER by highlighting housing outlays experienced by mortgaged homeowners.
Average Required Monthly Payment for Outstanding Mortgages
Figure 1 shows trends in required monthly payment between January 2019 and January 2024. In January 2019, the average required monthly payment was about $1,400. First-time homebuyers with mortgages and rural borrowers paid about $200 and $400 less on average, respectively.[7] Between January 2019 and January 2020, the average required monthly payment was largely unchanged. In early 2020, it fell by about $100, likely due to mortgage forbearance during the pandemic. In the middle of 2021, it began to rise. By the end of 2023, the average required monthly payment was nearly $1,800, 23 percent higher than before the pandemic.
Figure 1: Average Required Monthly Payment for Outstanding Mortgages
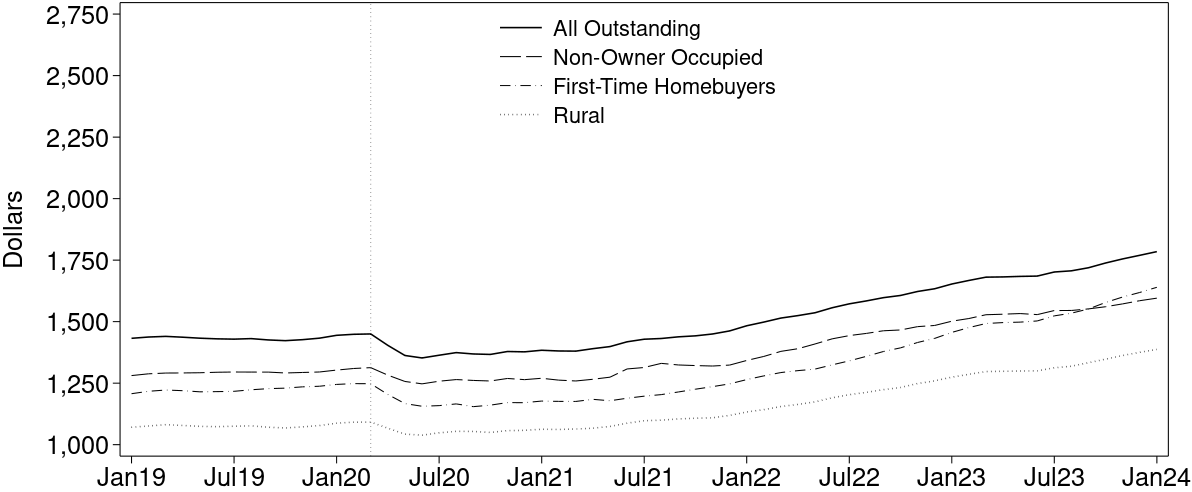
Source: FHFA, National Mortgage Database
Rural mortgages follow a similar trend. First-time homebuyers experienced a steeper rise in required payment after July 2022. The average outlay for first-time homebuyers rose by about 33 percent between January 2022 and January 2024. The average monthly payment for non-owner occupied properties rose at a slower pace, reflecting investors’ ability to take out a smaller loan, obtain alternative non-mortgage financing, or both.
Trends in Average Required Monthly Payment for New and Continuing Mortgages
Figure 2 illustrates trends in required monthly payment for new and continuing mortgages. New mortgages are those that were originated in the current quarter, and continuing mortgages are those that were originated in previous quarters. Rising cash outlays for new mortgages reflect larger mortgages due to higher house prices as well as higher interest rates. Most homeowners who did not obtain a new mortgage are largely insulated from such increases.[8] Changes in the required payment for homeowners who did not obtain a new mortgage likely reflect higher tax assessments, higher insurance payments collected in escrow, or both. A minority of mortgages in any given quarter originated in that quarter. During 2019, between 2 and 4 percent of active mortgages were new. This proportion rose to a high of nearly 8 percent in the fourth quarter of 2021 and fell to less than 2 percent at the end of 2023.
As shown in the left panel of Figure 2, between 2019 and 2021, the typical payment for a new mortgage was about $250 (or 16 percent) higher than that for a continuing mortgage. From 2021 to 2023, the average required payment on a newly originated mortgage rose by nearly $1,000 (or 57 percent) as interest rates and house prices rose.[9] In contrast, the typical required payment for a continuing mortgage rose by about $250 (or 18 percent) in that period, indicating an increase in escrow payments for taxes and insurance.[10]
Figure 2: Trends in Average Required Monthly Payment for New and Continuing Mortgages
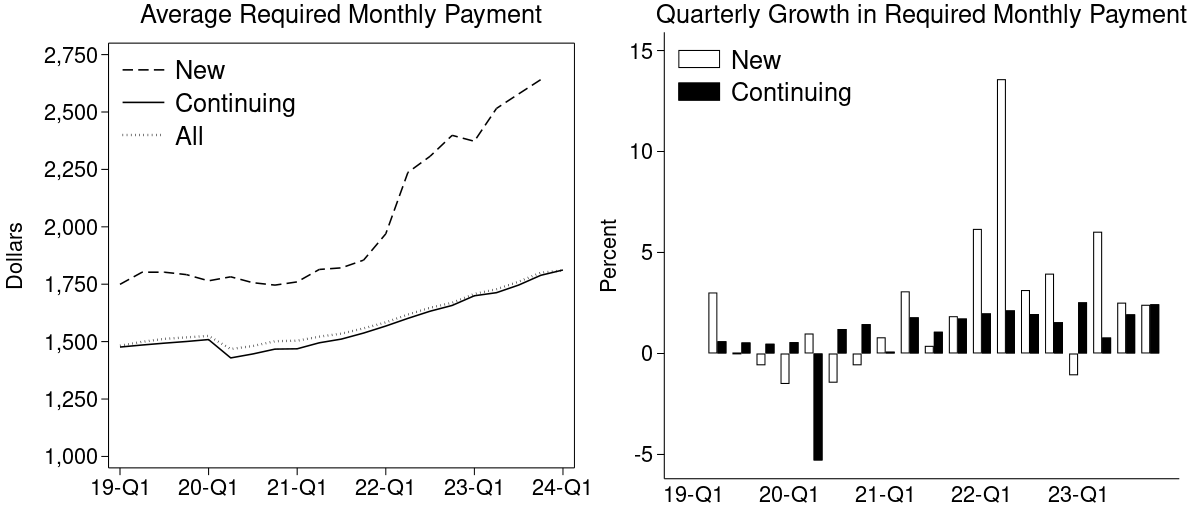
Source: FHFA, National Mortgage Database
As shown in the right panel of Figure 2, quarterly growth rates of the required monthly payment were somewhat uneven prior to 2022, reflecting changes in the interest rate environment as well as mortgage forbearance during the pandemic. However, from early 2022, growth in the required payment for new mortgages rose substantially, reaching a high of nearly 12 percent in the first quarter of 2022 and settling to about 6 percent at the end of 2023. Growth in required payments for continuing mortgages also rose to 1.5 to 2 percent per quarter through 2023. This is a significant growth in outlay for continuing mortgage borrowers whose mortgage contract was unchanged.
For comparison, from January 2020 to December 2023, OER grew by 22 percent, while the average monthly required payment for all mortgages grew by 24 percent, a difference of 2 percentage points.[11] This increase in the required payment includes both new and continuing mortgages, capturing payment changes for homeowners who moved to more expensive homes and those who refinanced to extract equity. In this regard, OER may more accurately capture the cost of a fixed housing consumption bundle. The average required payment for continuing mortgages grew by 18 percent, 4 percentage points less than OER. This lower growth relative to OER may not capture changes in the cost of maintenance and repairs. However, it measures growth in the direct cost required for homeowners to remain in their homes.[12]
Average Required Monthly Payment for Rural Borrowers and First-Time Homebuyers
Finally, Figure 3 highlights trends in required payments for rural and first-time homebuyers. The left panel of Figure 3 shows trends for new mortgages. The trends remain mostly flat between 2019 and 2021 and rise thereafter. The trend for rural borrowers follows the overall trend, while the trend for first-time homebuyers is steeper. Payments for new first-time homebuyers begin to rise slightly in 2020 after a small decline in 2019. Starting in 2021, payments for first-time homebuyers rise at a higher rate than that for all borrowers. Given new mortgages for first-time homebuyers are used for purchasing a home, the steeper trend likely reflects the rise in home values to 2022 and increasing interest rates through the end of 2023.
Figure 3: Average Required Monthly Payment for Rural Borrowers and First-Time Homebuyers
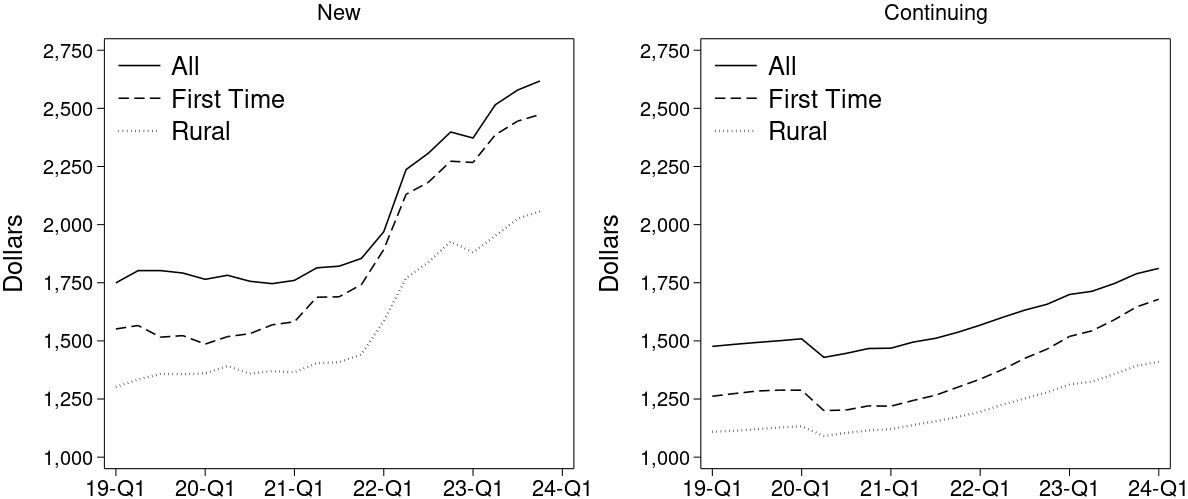
Source: FHFA, National Mortgage Database
The right panel of Figure 3 plots trends for continuing mortgages. As continuing mortgages comprise a majority of outstanding mortgages, this plot is very similar to Figure 1. However, the distinction between new and continuing mortgages illustrates the role of new home purchases in the aggregate. Trends in required payment for rural borrowers and first-time homebuyers are mostly parallel into 2022. A steeper rise for first-time homebuyers becomes apparent in 2022. This likely reflects the combined composition change from the previous two years. Cash outlays for first-time homebuyers had been rising for nearly two years before being clearly reflected in the aggregate.
Summary
This analysis shows a 14 percent ($270) increase in the average required monthly payment between the start of 2022 and the end of 2023 for all U.S. homeowners with a mortgage. This translates to a roughly 2 percent quarterly growth rate in their housing outlay. This combines increases for those who remained in their home, refinanced their mortgage including to extract equity, and those who purchased a new and potentially more expensive home. The growth in required payment for those who continued their mortgage is smaller than the overall increase and closer to 1.6 percent quarterly over the same period. Trends for rural borrowers and first-time homebuyers largely reflect the overall trend. However, an important distinction is the earlier and overall steeper rise in payments for new mortgages of first-time homebuyers, potentially indicating increased barriers to entry into the housing market.
[1] Homeownership rate in the United States is 66 percent; 59 percent of U.S. housing units are owner-occupied. See https://www.census.gov/housing/hvs/files/currenthvspress.pdf.
[2] For more information about the definition and calculation of OER, see https://www.bls.gov/cpi/factsheets/owners-equivalent-rent-and-rent.htm.
[3] This includes changes to housing quality and costs, such as for maintenance and depreciation.
[4] For a discussion, see a review by Martin et. al. (2023) available at https://www.bls.gov/osmr/research-papers/2023/ec230040.htm. See also Conner et. al. (2024) available at https://www.brookings.edu/articles/how-does-the-consumer-price-index-account-for-the-cost-of-housing/.
[5] Recent estimates from the American Community Survey suggest nearly 61 percent of homeowners have a mortgage. See https://data.census.gov/table/ACSDP1Y2022.DP04?q=tenure.
[6] See https://www.fhfa.gov/nmdbdata. For about 80 percent of NMDB mortgages, the required payment exceeds the implied amortizing payment by at least $100.
[7] First-time homebuyer is determined by reviewing the credit data of every borrower for prior mortgages. When no prior mortgage is found for the borrower, that borrower is defined as a first-time homebuyer. If any borrower associated with a loan is a first-time homebuyer, that loan is defined as a first-time homebuyer loan. Rural areas include all census tracts defined as rural by FHFA's Duty to Serve regulation.
[8] Over 90 percent of mortgages in the NMDB are fixed-rate.
[9] Note a brief decline in required payments at the start of 2023. This corresponds to a brief period of lower interest rates with no significant change in house prices.
[10] This is a quarterly calculation. Some new originations in the previous quarter are counted as continuing mortgages in the following quarter. Nevertheless, given their low share, the increase is mostly driven by higher payments among continuing mortgages rather than changes in the cohort composition of mortgages. Using only mortgages originated prior to 2022 and still active at the end of 2023, the increase is about $150.
[11] See https://fred.stlouisfed.org/series/CUSR0000SEHC.
[12] Another measure frequently followed is the Federal Reserve’s debt service ratio (DSR). The DSR has not risen since 2020. DSR trends can be found at https://fred.stlouisfed.org/series/MDSP. See https://www.federalreserve.gov/pubs/bulletin/2003/1003lead.pdf for a description of the DSR and its construction.
By: Daniel Grodzicki
Principal Economist
Office of Data and Statistics
Division of Research and Statistics
By: Saty Patrabansh
Associate Director
Office of Data and Statistics
Division of Research and Statistics
By: Jonathan Spader
Supervisory Economist
National Mortgage Database Branch
Division of Research and Statistics