Lump-sum cash transfers are occasionally used by policymakers with the goal of temporarily increasing household consumption. These policies will be ineffective if the transfer is used to save or pay off debts instead of purchasing goods. Because of this, macroeconomic policies are usually evaluated in terms of marginal propensity to consume (MPC), which measures how much a household spends after income rises. Accurately approximating MPCs by income and wealth is crucial for assessing macroeconomic policy decisions. This blog will discuss a recently released FHFA working paper, “Mortgage Debt and the Response to Fiscal Transfers”.
Since nationwide cash transfers have been used seldomly in practice, estimating MPCs is challenging. Instead, researchers use theoretical models to predict reactions of different consumers. Existing models have generally abstracted from explicitly modeling the mortgage market, focusing only on the net value of housing equity instead of the relative stocks of mortgage debt and home values. Similar levels of housing equity can entail very different levels of monthly payments and leverage. Monthly minimum payments leave households with mortgages with less disposable income for consumption spending. Higher levels of housing leverage cause more of a monthly payment to be lost to interest instead of building equity, which generates even stronger constraints on spending.
The recent FHFA working paper studies the response of consumers to fiscal transfers in a model with an explicit mortgage market. Model parameters are chosen to reproduce several aspects of cross-sectional data on leverage, liquidity, and net worth. An important addition is targeting the fraction of hand-to-mouth households who have close to zero liquid wealth. These people are the most likely to respond strongly to a cash transfer. This contribution allows for more policy-relevant analysis by ensuring that modeled spending responses are realistic and consistent with the data.
A very strong relationship emerges between mortgage debt and propensity to spend a transfer, consistent with empirical evidence. Table 1 summarizes the relationship between debt and MPC for homeowners in the model with mortgages. The first two columns (bolded in red) show that homeowners with positive debt are predicted to have an average MPC six times larger than homeowners without debt. Additionally, higher levels of debt are associated with higher spending responses, which is shown in the last four columns of Table 1.
Table 1: Average MPC by Loan-to-Value Ratio for $500 Transfer, Model with Mortgages
| Range of LTV Ratio | ||||||
|---|---|---|---|---|---|---|
| 0.0 | >0.0 | 0.0-0.25 | 0.25-0.5 | 0.5-0.75 | >0.75 | |
| Average MPC | 0.04 | 0.24 | 0.11 | 0.18 | 0.26 | 0.30 |
Source:FHFA, Author's calculation
While MPCs generally increase with debt, they are found to be poorly correlated with income. Homeowners with mortgages in the top half of the income distribution have larger MPCs compared to most households in the bottom half of the income distribution. Table 2 summarizes average MPCs within different percentiles of the income distribution in the model with mortgages as well as those from a standard model of consumer spending without mortgages.
Table 2: Average MPC by Income Percentile, $500 Transfer
| Range of Income Percentile | ||||||
|---|---|---|---|---|---|---|
| <10 | 10-25 | 25-50 | 50-75 | 75-90 | >90 | |
| Model with Mortgages | 0.24 | 0.11 | 0.13 | 0.19 | 0.18 | 0.16 |
| Standard Model | 0.15 | 0.18 | 0.17 | 0.14 | >0.13 | 0.12 |
Source:FHFA, Author's calculation
The three ranges of income with the largest levels of MPC are bolded and colored in red for each model. The standard model from the literature predicts that households with the highest MPC are all in the bottom half of the income distribution, while the model with mortgages predicts that most of the highly responsive households are homeowners in the top half of the income distribution. This leads to very different policy implications from the two models, which is explored in Figure 1 below.
Figure 1: Spending Per Transfer by Share of Homeowners Given $500 Transfer
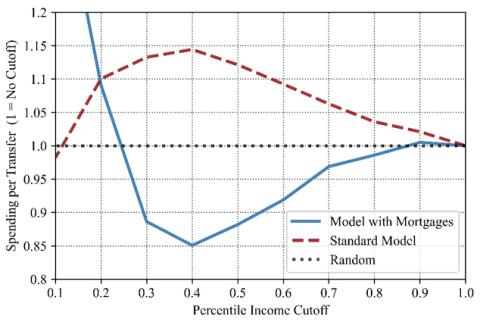
Figure 1 shows the predictions of each model for restricting transfers based on income. The solid blue line plots the spending per transfer in the model with mortgages as the transfer is progressively given to a larger fraction of households, ordered by their income. The red dashed line plots the same for the standard model without mortgages. The black dotted line at the center of the figure represents the spending per transfer if transfers are limited to a random fraction of the population instead of by income level, which is constant. The figure demonstrates how not including mortgages can lead to erroneous policy implications. For example, the standard model predicts giving a $500 transfer to only households in the bottom 40 percent of income would increase spending per transfer by about 15 percent relative to a randomly distributed transfer. Meanwhile, the model with mortgages predicts a 15 percent decrease in spending per transfer for the same policy. Homeowners with mortgages are relatively more responsive to the transfer, and this feature is overlooked in popular macroeconomic models of consumer spending. The model described in the recently released FHFA working paper shows correcting for this omission can help produce more plausible policy analyses.
By:Ross Batzer
Senior Economist
Office of Research and Analysis
Division of Research and Statistics
Tagged: FHFA Stats Blog; Source: FHFA; Mortgage Debt; Fiscal Transfers; marginal propensity to consume (MPC)