Introduction
Land values are highly correlated with mortgage collateral risks and underlying location desirability; hence, these data are in high demand by researchers and policymakers. As a means with which to determine the replacement value of a structure, they are also important for estimating insurance premiums.
In 2021, Davis, Larson, Oliner, and Shui estimated and made available an annual panel dataset for single-family residential land prices from 2012-2019 at the tract level.[1] We have updated these data through 2022, which will enable data users to gain insights into land price appreciation over the course of the COVID-19 pandemic. Interested readers may download these updated data at https://www.fhfa.gov/sites/default/files/2024-08/Land-Prices_2024_20_June.xlsx. In this blog post, we share some preliminary insights from these data.
Methodology
In updating the land price indices by an additional three years, we made no changes to the methodology as implemented in the published 2021 paper. We refer readers to the 2021 paper for more information on this methodology.
As in the previous paper, we compute two kinds of land value estimates, both of which are provided in the linked dataset. First, we compute as-is estimates, which are straightforward, per-acre values of land. We also report standardized estimates, which report land prices for hypothetical lots of a quarter-acre size, which is approximately the median lot size in our data. These estimates address the plattage effect, which refers to the observation that larger lots typically cost less on a per-acre basis, and thus value may be accreted by dividing larger lots into smaller ones.
Summary Statistics
Using a very large data set of appraisals, we generate annual panel data from 2012 through 2022 of the average price of land for single-family homes for 1,054 counties, 8,660 ZIP codes, and 12,057 census tracts. Additionally, we create a “pooled cross-section” dataset, which combines all data from 2012 through 2022 in the appraisal database and centers the estimates using 2015 prices. Pooling increases the number of geographic areas that satisfy the minimum required sample sizes.
Relative to the earlier data, improved geocoding as well as the additional years of data enables a modest increase in covered geographies. In what follows, we report increases relative to 2019 in parentheses. Our pooled cross-section includes data for 2,444 (+66) counties, 19,397 (+1,075) ZIP codes, and 54,515 (+1,371) census tracts. In the second dataset, we do not pool data by year and simply report annual estimates for a balanced panel. Given our minimum data requirements, we report land prices for 1,054 (+94) counties, 8,660 (+1,218) ZIP codes, and 12,057 (+1,542) census tracts each year from 2012 through 2022. The annual and pooled data sets cover 87 percent and 99 percent of the U.S. population residing in the 50 states and the District of Columbia, respectively, and 85 percent and 98 percent of the single-family housing units. The coverage difference between the annual and pooled datasets is small because well-populated areas are included in both.
Table 1 shows some basic statistics from our as-is estimates generated by applying an equal weight to each county. The top panel reports estimates from the pooled cross-section of counties, and the bottom panel reports estimates from the annual panel data of counties (pooled to cover 2012–2022). As in the previous data, both land prices and land shares display large variation. Land prices and land shares are uniformly higher in the panel data as many rural counties with cheap land and low land shares are dropped due to insufficient observations.
Table 1: Land Statistics
As-Is Estimates of Land Value Reported Per Acre
| Pooled Cross Section (2,444 Counties): | |||||||||
|---|---|---|---|---|---|---|---|---|---|
| Variable | 1st | 10th | 25th | 50th | 75th | 90th | 99th | Avg. | Std. Dev. |
| Land Value | 10,500 | 19,300 | 30,800 | 52,000 | 95,700 | 202,900 | 1,316,700 | 148,055 | 1,273,266 |
| Land Share | 7.5% | 11.2% | 14.0% | 17.9% | 23.9% | 32.3% | 50.6% | 20.1% | 8.9% |
| Annual Panel, Pooled (1,054 Counties): | |||||||||
| Variable | 1st | 10th | 25th | 50th | 75th | 90th | 99th | Avg. | Std. Dev. |
| Land Value | 22,200 | 38,800 | 58,100 | 100,200 | 192,300 | 413,600 | 3,285,300 | 250,654 | 808,597 |
| Land Share | 10.5% | 15.0% | 18.1% | 22.9% | 29.8% | 39.5% | 59.3% | 25.3% | 10.2% |
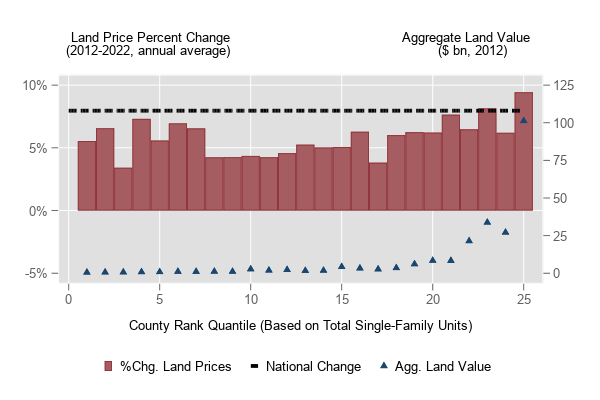
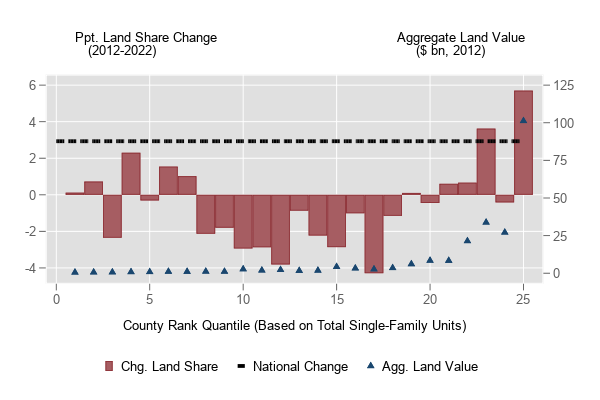
We estimate that the land share for the United States in the aggregate increased from 37.0 percent in 2012 to 39.9 percent in 2022. This nearly 3 percentage point increase was driven by a rapid increase in land prices at the national level of 8.0 percent per year that outstripped the national rise in house prices. In Figure 1, we sort counties into 25 bins based on the number of single-family housing units over 2013–2017. Each bin represents the experience of about 40 counties. The blue triangles in each bin show the aggregate value of land in single-family, residential use in 2012 for all the counties included in each bin. These triangles represent the weight for each bin in the national aggregate.
Land Price Appreciation since the Onset of the Pandemic
Figure 1: Changes in Land Prices and Land Shares by County-Based Quantiles of Housing Units, 2012-2022
(a) Changes in Land Prices
(b) Changes in Land Shares
Source: FHFA
Note: Counties in the annual panel data set are sorted into 25 bins based on the number of single-family housing units in 2013–2017, as measured in the American Community Survey for those years (5-year sample). In both panels, the blue triangles show the aggregate value of land in 2012 for all the counties in each bin. In the left (right) panel, the red bars show annualized growth in the price of land (change in the land share) for each bin and the black dashed line shows annualized growth in the price of land (change in the land share) in the aggregate United States between 2012 and 2022, 7.96 percent (2.9 percentage points) per year.
The red bars in the left panel of Figure 1 show the change in as-is land prices in each bin from 2012 to 2022, and the red bars in the right panel show the change in the land share over the same period. The right-most bin alone, which is dominated by counties in California, has greater aggregate land value than all 24 other bins combined and 4.6 times the land value of the bottom 18 bins combined. This explains why the increase in land prices at the national level over 2012–2022 – 7.96 percent per year on average, as shown by the black dashed line – outpaced the much slower rise in most of the county bins.
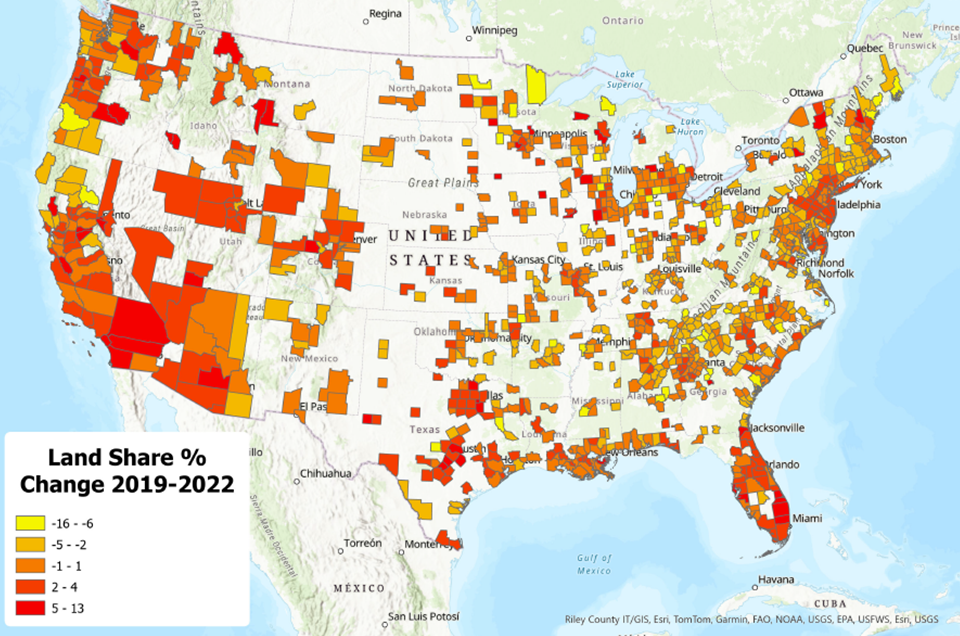
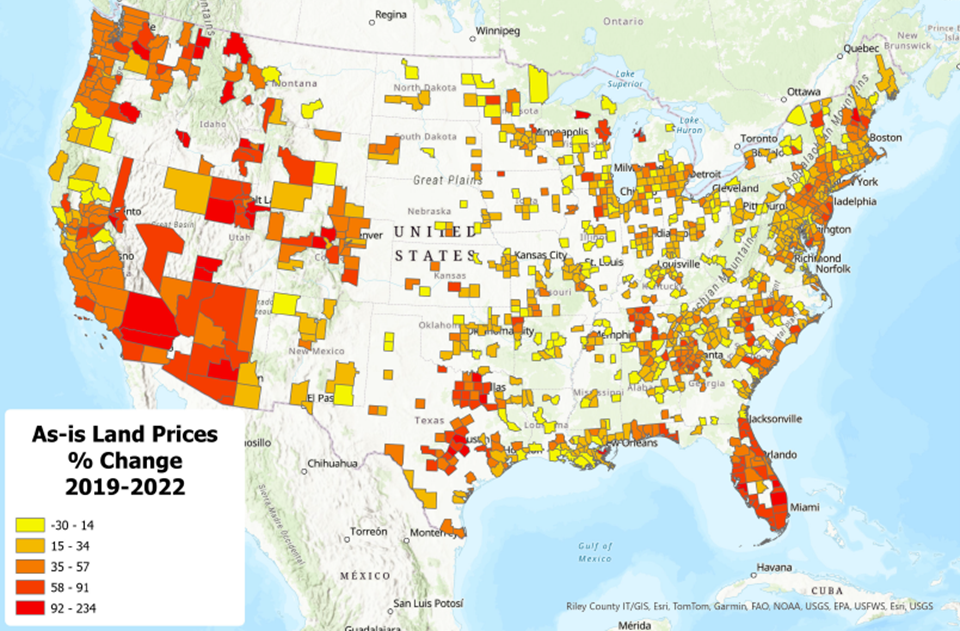
To provide clarity on the geographic heterogeneity of the national trend presented in Figure 1, especially as affected by the COVID-19 pandemic, Figure 2 presents maps of land share and as-is land price appreciation since 2019. While 66.2 percent of counties nationwide saw flat or declining land shares, 95.1 percent of counties saw appreciating land prices. Reinforcing certain stylized facts about pandemic-era housing markets, the three counties we observe to have had the most appreciation in land prices are rich in natural amenities. These are Teton County, Wyoming, St. Lucie County, Florida, and Canyon County, Idaho. Similarly, the three counties with the greatest land share appreciation also support a shift in homeowner preferences toward larger properties with greater access to outdoor recreation opportunities; these are San Bernadino County, California, Vilas County, Wisconsin, and Washington County, Utah.
Figure 2: Mapped Changes of County-Level Land Shares and Land Prices
(a) County-Level Changes to Land Shares
(b) County-Level Changes to As-Is Land Prices
Source: FHFA
Panel (b) reinforces the interpretation that rapid changes in the value of housing, as observed in the Sunbelt states since the outbreak of COVID-19, were driven by changes in the underlying value of the land. Yet panel (a) suggests land share increases were modest. Major metropolitan areas subject to pandemic-era in-migration saw increases to land shares on the order of 5-13 percent. Large swathes of the country, including rural and suburban counties in the Midwest and the Eastern seaboard, saw flat to decreasing land shares. This is consistent with widely reported inflation in construction costs during the pandemic. Because of elevated replacement costs relative to land price appreciation, land share decreased, even as house values boomed.
Summary
Using a very large data set of appraisals, we generate annual panel data from 2012 through 2022 of the average price of land for single-family homes for 1,054 counties, 8,660 ZIP codes, and 12,057 census tracts. We also calculate pooled cross-sectional estimates of land prices for more than twice as many counties and ZIP codes and five times as many census tracts. We describe changes in the level and growth rate of land prices inclusive of pandemic-era home price appreciation. We expect that researchers will use the data we generate to build on our results, and current and future policymakers will monitor these data to better understand a variety of risks in housing markets.
[1] These data are available for download at https://www.fhfa.gov/research/papers/wp1901.
Tagged: FHFA Stats Blog; Land Prices; Replacement Cost; Data; Open Data; Source: FHFA
By: Matthew Suandi
Senior Economist
Division of Research and Statistics
File Attachments: