Introduction
As the nation's first publicly available dataset of aggregate statistics on appraisal records, the Federal Housing Finance Agency's (FHFA's) new Data Files and Dashboards give the public access to a broad set of data points and trends found in appraisal reports. In our latest blogpost in the series providing insights about fair lending, appraisal values, and sizes of homes, we utilize new statistics about appraisal values for purchases of single-family homes in the national data and state data files.
In this blogpost, we seek to answer “How are appraisal values related to house price movements?" by looking at appraisal values, as measured by: (1) the change in median quarterly appraisal value for purchase-only loans coming from the UAD Aggregate Statistics, and (2) house price appreciation, as tracked by the quarterly purchase-only FHFA House Price Index® (HPI).[1]
Rather than house prices driving future appraisal values, our findings suggest that on a national basis, appraisal values reflect the past values of home prices.[2] Additionally, we see that appraisal values tend not to adjust up or down as much as house price measures. Finally, we explore this relationship across states and find some disparities.
Appraisals and HPI at the National Level
Both purchase (median) appraisal values and HPI have generally increased since 2013 with sharp increases beginning in the third quarter of 2020 around when the restrictions on economic activity eased following the first wave of the COVID-19 pandemic.
Figure 1 makes it seem as though appraisal values (in dollar amounts with the red dashed line) move closely with house prices (in an index with the solid blue line). However, comparing these two series is somewhat misleading because we measure them in different units, one in dollars and the other as an index (note the two different axes in the figure). Therefore, to make a more apples-to-apples comparison, we convert the (median) appraisal value to an index and normalize both series by setting them equal to 100 in the same initial period.[3] Both series are now expressed in terms of cumulative percentage growth since the first quarter of 2013.
Figure 1: Median Appraisal Value and FHFA HPI

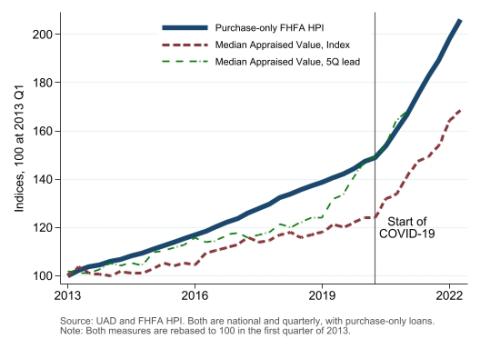
Figure 2 illustrates the normalized indices, where the reference line corresponds to the start of major economic impacts from the COVID-19 pandemic around the end of the first quarter of 2020. Two observations stand out. First, appraisal values appear to be more volatile (i.e., less smooth) than the measured price appreciation.[4] Second, appraised values are consistently below the HPI, or behind it in their timing. For example, at the start of COVID-19 the graph indicates that house prices increased by about 50% since the first quarter of 2013, while appraised values increased by only about 25% over the same period.
To better align the two, we would need to shift the appraisals to the left, as the green dot-dash line indicates in Figure 2. The implication is that changes in appraisal values reflect prior house price movements. In other words, appraisers incorporate past house price changes into their professional valuations.[5] Consequently, appraisers' jobs can be challenging when house prices change suddenly or rapidly: past values of house price changes are less useful in determining the current value of a home. In the last few years, we have seen sudden and rapid price increases during the COVID-19 pandemic, and appraisers have faced a difficult task of adjusting prices upward fast enough, but not too much, during this unique period.[6]
Figure 2: Re-Based Median Appraisal Value and FHFA HPI

The lagged relationship suggested by Figure 2 is consistent with the idea that appraisers use observed past values of home price appreciation captured by the HPI when forming estimates of an appraised value.
Appraisals and HPI at the State Level
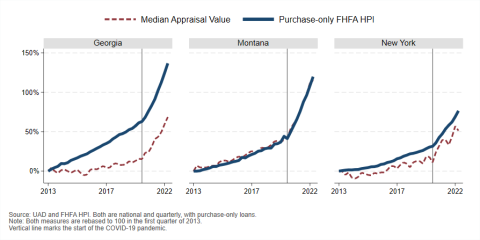
We perform a similar exercise at the state level. The gap between the appraisal value index and HPI varies quite a bit across states and time. Figure 3 presents the gap for Georgia, Montana, and New York. Note that both Georgia and Montana have similarly large cumulative appreciations since 2013. However, the appraisal index has grown much slower in Georgia than in Montana. Meanwhile, New York has relatively modest gains for both HPI and appraisals.
Figure 3: Highlighting the Different Gaps Between Series for Select States

We deliberately choose Georgia and Montana because they are among the states with the largest increase in HPI over the period. Usually, the appraisal index tends to keep up with HPI in smaller markets that are less “hot" while the HPI outpaces the appraisal index where housing activity has increased quickly, and price escalations have created volatile real estate environments. This is not always the case, as Montana clearly shows a small gap despite large HPI increases. The perfect description is tricky because housing markets are hyper-local and even state measures may not be granular enough. We encourage interested readers to dig further to help uncover the mechanisms for the differences.
Summary
In conclusion, at the national level, both appraised values and home prices have increased since 2013, though the growth in appraised values has not kept pace with growth in house prices. It may be difficult to use changes in appraisal values to predict future changes in home prices. In fact, the graphs above suggest the signal goes the other way: that past home prices are used to set and adjust current appraisal values. Combining the UAD Aggregate Statistics with the FHFA HPI allows us to explore new relationships with publicly available aggregate data. As mentioned in previous blogposts, data caveats are necessary. We only examine trends for single-family homes that have been purchased using a conventional, conforming mortgage. Future work could incorporate valuations for different property types, refinances, or other mortgage market segments. We hope the discussion shows how the UAD Aggregate Statistics Data File and Dashboards offer new ways to harness useful information for policy-relevant discussions.
[1] The data can be found at https://www.fhfa.gov/house-price-index?tab=HPI%20Datasets. A technical description, frequently asked questions, reports, and focus pieces can be found at https://www.fhfa.gov/fhfa-house-price-index. The repeat-sales index is the industry gold standard since it is “constant-quality" and suffers less than mean or median values from sampling differences.
[2] This result is consistent with academic studies on this issue.
[3] Note that the repeat-sales methodology behind the FHFA HPI uses only homes for which we observe multiple transactions, while the appraisals use all homes. We leave it to future work to determine the importance of this difference.
[4] Note that HPI is typically likely to be smoother due to the manner in which the data are estimated, and also the fact that seasonal adjustments are made.
[5] Another way of describing the relationship is that their work does not appear to influence future house prices.
[6] Alternatively, it could be that with rapid appreciation homes are above their fundamental values, and that appraisers' valuations are closer to the true value. We leave that idea for future work to explore.
Tagged: FHFA Stats Blog; Aggregate Statistics; Appraisals; Data; Data Dashboards; House Prices; Open Data; Source: FHFA; Uniform Residential Appraisal Report (URAR)
By: Justin Contat
Senior Economist
Office of Research and Analysis
Division of Research and Statistics
By: Daniel Lane
Research Assistant
Office of Research and Analysis
Division of Research and Statistics