While the number of U.S. home appraisals and median appraised values declined year-over-year between the second quarters of 2022 and 2023, both indicators increased between the first and second quarters of 2023.
This blog summarizes key findings from the Federal Housing Finance Agency’s (FHFA) 2023Q2 update of the Uniform Appraisal Dataset (UAD) Aggregate Statistics Data File and Dashboards released on September 29, 2023. The UAD Aggregate Statistics is the only publicly available data providing insights on U.S. home appraisals. Since October 2022, the Agency has published the UAD Aggregate Statistics quarterly.
Year-Over-Year Changes in the United States (2022Q2-2023Q2)
Table 1: Year-over-Year Changes in Number of Appraisals and Median Appraised Value by Loan Purpose for the United States (2022Q2-2023Q2)
| Loan Purpose for Appraisal | Statistic | 2022Q2 | 2023Q2 | Percent Change |
|---|---|---|---|---|
| Purchase or Refinance | Number of Appraisals | 1,192,090 | 783,588 | -34.3% |
| Purchase | 843,524 | 603,714 | -28.4% | |
| Refinance | 348,566 | 179,874 | -48.4% | |
| Purchase or Refinance | Median Appraisal Value (Dollars) | 395,000 | 390,000 | -1.3% |
| Purchase | 400,000 | 395,000 | -1.3% | |
| Refinance | 376,000 | 370,000 | -1.6% |
Table 1 shows that from 2022Q2 to 2023Q2, the number of appraisals decreased by 34.3 percent for purchase and refinance loans combined, 28.4 percent for purchase loans only, and 48.4 percent for refinance loans only. During this same period, the median appraised value declined 1.3 percent for purchase and refinance loans combined, 1.3 percent for purchase loans only, and 1.6 percent for refinance loans only.
Quarter-Over-Quarter Changes in the United States (2023Q1-2023Q2)
Table 2: Quarter-over-Quarter Changes in Number of Appraisals and Median Appraised Value by Loan Purpose for the United States (2023Q1-2023Q2)
| Loan Purpose for Appraisal | Statistic | 2023Q1 | 2023Q2 | Percent Change |
|---|---|---|---|---|
| Purchase or Refinance | Number of Appraisals | 646,476 | 783,588 | 21.2% |
| Purchase | 483,630 | 603,714 | 24.8% | |
| Refinance | 162,846 | 179,874 | 10.5% | |
| Purchase or Refinance | Median Appraisal Value (Dollars) | 382,000 | 390,000 | 2.1% |
| Purchase | 386,000 | 395,000 | 2.3% | |
| Refinance | 370,000 | 370,000 | 0.0% |
Table 2 shows that from 2023Q1 to 2023Q2, the number of appraisals increased by 21.2 percent for purchase and refinance loans combined, 24.8 percent for purchase loans only, and 10.5 percent for refinance loans only. During this same period, the median appraised value increased 2.1 percent for purchase and refinance loans combined and 2.3 percent for purchase loans only, but did not change for refinance loans.
Year-Over-Year Changes in Median Appraised Value by State (2022Q2-2023Q2)
Figure 1: Percent Change in Median Appraised Value Year-over-Year: 2022Q2 to 2023Q2
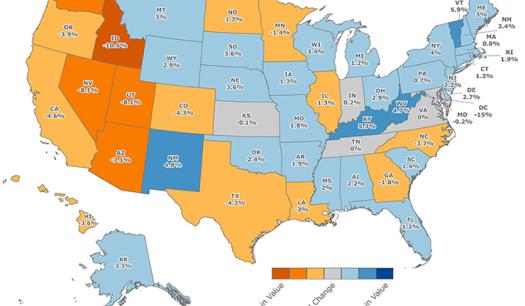
Figure 1 depicts the year-over-year percent change in median appraised value for each state and the District of Columbia. The largest declines were primarily concentrated in the western states. The states of Vermont, Kentucky, West Virginia, and New Mexico had the largest gains.
Quarter-Over-Quarter Changes in Median Appraised Value by State (2023Q1-2023Q2)
Figure 2: Percent Change in Median Appraised Value Quarter-over-Quarter: 2023Q1 to 2023Q2
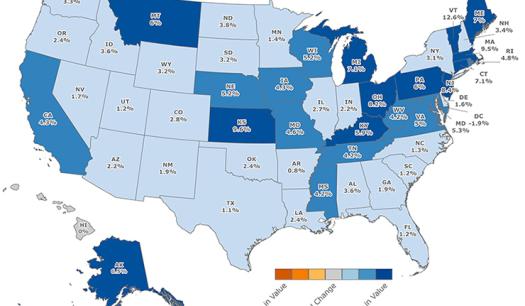
Figure 2 depicts the quarter-over-quarter percent change in median appraised value for each state and the District of Columbia. The states of Vermont, Kansas, and Massachusetts had the largest gains. The District of Columbia had the only decline, down 1.9 percent.
Summary
The FHFA 2023Q2 UAD Aggregate Statistics show that the number of appraisals and median appraised values declined over the last year but increased over the last quarter.
The UAD Aggregate Statistics continue to serve as a valuable resource through which to obtain information on home appraisals. FHFA is a trusted and leading source of housing finance data, and the routine release of UAD Aggregate Statistics provides transparency to the public on this important topic.
For additional aggregate statistics at the national, state, and metropolitan area levels, see the UAD Aggregate Statistics Advanced Analytics Dashboard. Trends in the Top 100 Metropolitan Statistical Areas are available in our interactive dashboard: UAD Aggregate Statistics Top 100 Metro Areas Dashboard | FEDERAL HOUSING FINANCE AGENCY (fhfa.gov)
Tagged: FHFA Stats Blog; Aggregate Statistics; Appraisals; Data; Data Dashboards; Open Data; Source: FHFA
By: Rashida Dorsey-Johnson
Branch Chief, Statistical Products
Office of the Chief Data Officer
Division of Research and Statistics
By: Diego Saltes
Senior Survey Statistician, Statistical Products Branch
Office of the Chief Data Officer
Division of Research and Statistics