This week, FHFA released the Mortgage Loan and Natural Disaster Dashboard that enables users to assess the impact of natural disaster risk on vulnerable communities as well as the distribution of physical hazard risk for 2022 loan acquisitions by FHFA’s regulated entities.
Data
This dashboard combines three data sources. The first, FHFA’s Public Use Database (PUDB), reports single-family and multifamily acquisitions for Fannie Mae and Freddie Mac (the Enterprises), and the Federal Home Loan Banks (FHLBanks). The single-family dataset contains loan-level data on the number of loans and acquisition unpaid principal balance (UPB). The multifamily dataset contains property-level data on the number of properties and acquisition UPB. The FHLBank dataset contains loan counts and acquisition UPB for single-family loans acquired by the FHLBanks. The smallest geographic area available is the 2020 census tract. The dashboard uses the most recent PUDB release from 2022.
The second source is the Federal Emergency Management Agency’s (FEMA) National Risk Index (NRI). The NRI is a dataset and tool that maps 18 different natural hazards at the 2020 census-tract level.[1] The 18 hazards include coastal flooding, drought, hurricane, and wildfire, among others. The NRI also includes measures of social vulnerability and community resilience. These measures provide information about a community’s susceptibility to natural hazards as well as its ability to recover. The dashboard uses the most recent data from March 2023.
The third source is FHFA’s Duty to Serve 2023 high-needs rural areas counties data. High-needs rural areas include regions that are in a “rural area” and Middle Appalachia, the Lower Mississippi Delta, a colonia census tract, and tracts located in a persistent poverty county and not in one of the previous three categories.[2]
The dashboard uses loan counts and acquisition UPB aggregated to the 2020 census-tract level. This census-tract level data from the PUDB has been merged with the NRI data. Then, the high-needs county designations from FHFA’s Duty to Serve program are merged into these data. These data include estimated damages from disasters for buildings, population, and agriculture. Thus, locations with more buildings, population, and agriculture will have relatively higher damages. These data do not include insurance coverage and do not necessarily represent potential credit losses for FHFA’s regulated entities.
Insights on Hurricanes
Atlantic Hurricane season starts June 1 and ends November 30. However, most hurricane activity occurs from mid-August to mid-October.[3] For 2024, the National Oceanic and Atmospheric Administration (NOAA) predicted an above-normal season with 85 percent probability. NOAA notes that this is “due to a confluence of factors, including near-record warm ocean temperatures in the Atlantic Ocean, [and] development of La Niña conditions in the Pacific” among other factors.[4] This blog post evaluates potential risks to loans acquired by the Enterprises and the FHLBanks in 2022 and their hurricane risk exposure. Note that in this dashboard, we only evaluate acquisitions in 2022 rather than the total portfolio of the Enterprises and the FHLBanks. Some loans acquired in 2022 may no longer be active in the Enterprises and the FHLBanks’ books of business in 2024.
NRI on Hurricane Risk
The NRI uses NOAA’s HURDAT2 Best Track Data Archive.[5] This dataset includes information on Atlantic and Pacific tropical cyclones, such as geospatial data on the path of previous storms, windspeed, central pressure, and hurricane size. The NRI identifies hurricane exposure based on historic hurricane paths. Then, to calculate historic loss ratios, the NRI incorporates data from SHELDUS at the county level for buildings expected to be impacted by hurricanes.[6] Next, the NRI calculates expected annual loses by calculating exposure probability multiplied by frequency multiplied by historic loss ratios.[7]
Composite risk scores factor in Expected Annual Losses (EALs) from physical risk, social vulnerability, and community resilience. Hurricane risk in the continental United States is concentrated in the gulf states and the east coast.
2022 Acquisitions by the Enterprises and FHLBanks and Hurricane Risk
Fannie Mae, Freddie Mac, and the FHLBanks acquired 3,838,894[8] single-family loans in 2022 for a total of almost $1.2 trillion in acquisition UPB. Fannie Mae and Freddie Mac acquired 8,016 multifamily properties in 2022 for a total of over $133 billion in acquisition UPB.
Stakeholders can use the dashboard to evaluate the distribution of acquisitions by the Enterprises and FHLBanks in 2022 and hurricane risk as defined by the NRI. Figure 1 shows this distribution. Of all single-family loan acquisitions, 5.22 percent ($60.8 billion in UPB) were in very high-risk-tracts, and 7.22 percent ($84.1 billion in UPB) were in relatively-high-risk tracts. Of all acquisitions in Duty to Serve high-needs rural counties, 4.41 percent ($1.02 billion in UPB) were in very-high-risk-tracts and 9.11 percent ($2.11 billion in UPB) were in relatively-high-risk tracts. The concentration of acquisitions in Duty to Serve high-needs rural counties in very-high-risk counties is slightly lower than in overall single-family acquisitions in 2022 (4.41 percent versus 5.22 percent).
Of all multifamily property acquisitions, 4.78 percent ($6.38 billion) were in very high-risk-tracts, and 8.68 percent ($11.59 billion) were in relatively-high-risk tracts. Of all multifamily acquisitions in Duty to Serve high-needs rural counties, 5.87 percent ($0.06 billion) were in very-high-risk-tracts and 15.23 percent ($0.16 billion) were in relatively-high-risk tracts. The concentration of acquisitions in Duty to Serve high-needs rural counties in very-high-risk counties is higher than in overall multifamily acquisitions in 2022 (5.87 percent versus 4.78 percent) but the dollar-value of acquisitions is relatively low in comparison to the overall books of business.
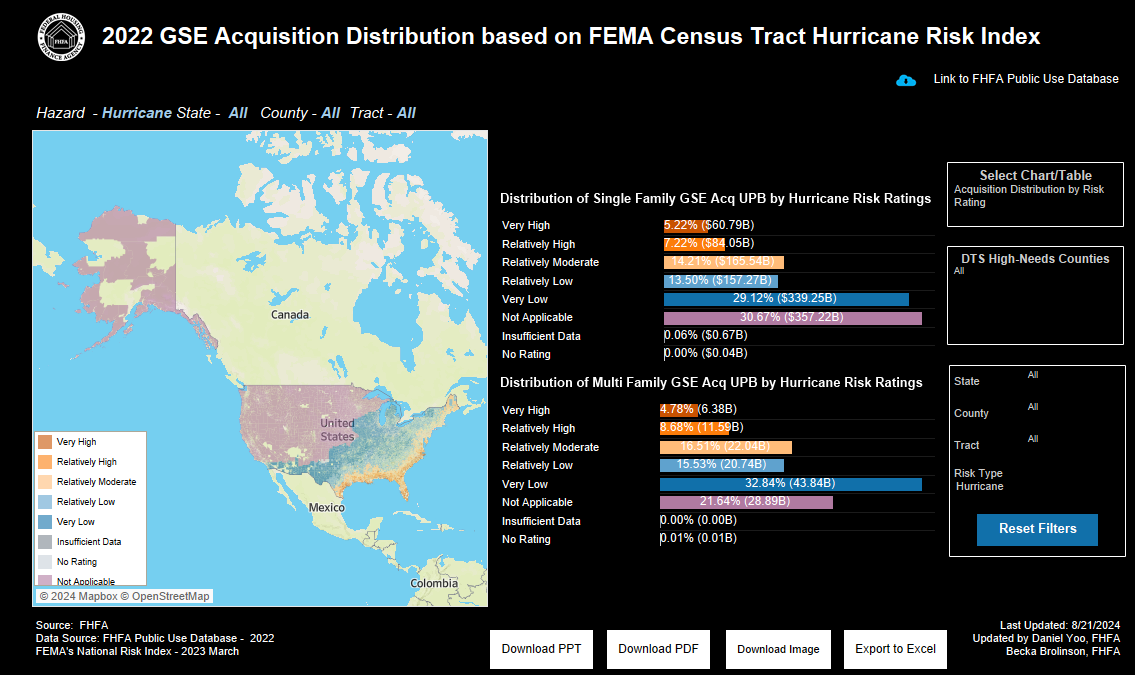
Figure 1: Distribution of 2022 Acquisitions by the Enterprises and FHLBanks by Hurricane Risk
Hurricane Beryl
Hurricane Beryl was the first hurricane to make landfall in the United States in 2024. Hurricane Beryl landed near Matagorda, Texas at 4:00am on July 8 as a Category 1 hurricane.[9] On July 9, a presidential disaster declaration was issued for Texas. All areas in the state are eligible for assistance under FEMA’s hazard mitigation grant program. Figure 2 shows counties eligible for individual or public assistance. There are 17 counties eligible for individual assistance (listed in red): Brazoria, Chambers, Fort Bend, Galveston, Harris, Jackson, Jasper, Jefferson, Liberty, Matagorda, Montgomery, Nacogdoches, Orange, Polk, San Jacinto, Walker, and Wharton counties.
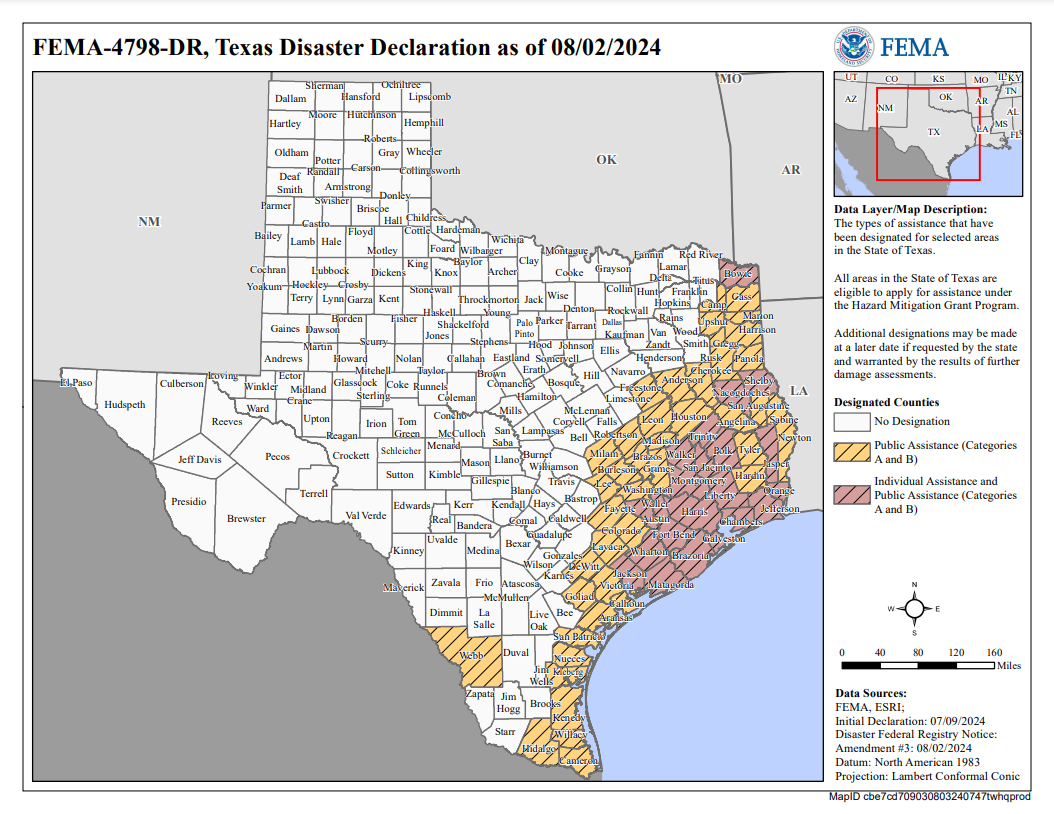
Figure 2: Texas Disaster Declaration for Hurricane Beryl
Source: https://gis.fema.gov/maps/dec_4798.pdf
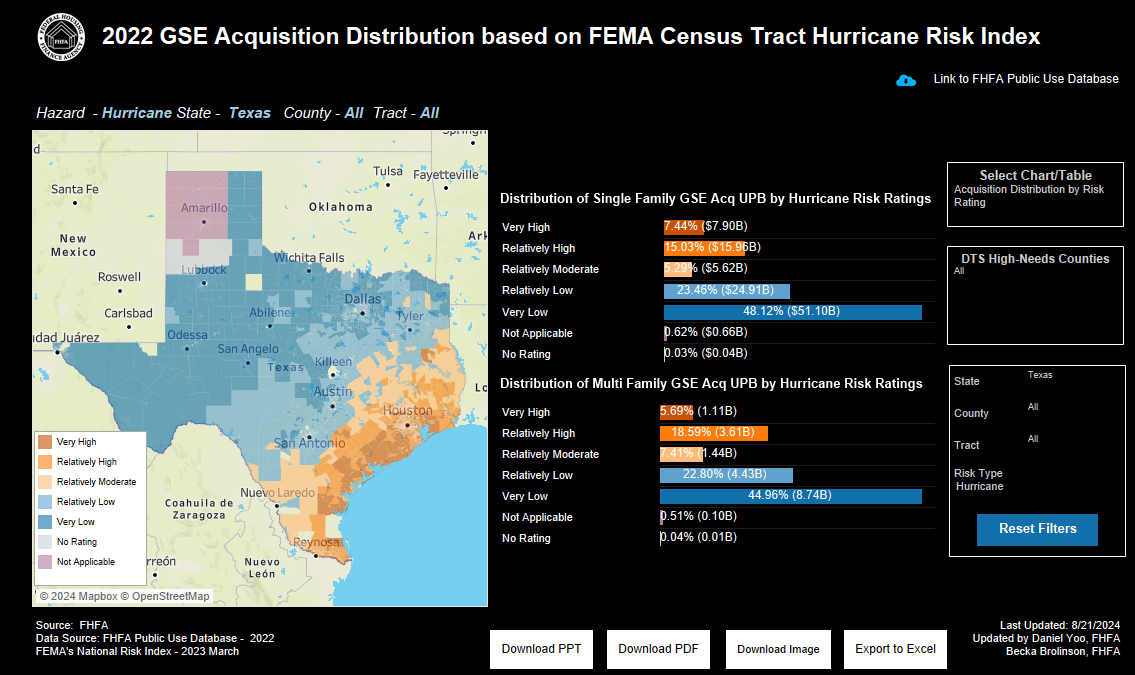
Figure 3: Distribution of Hurricane Risk for Acquired UPB in Texas
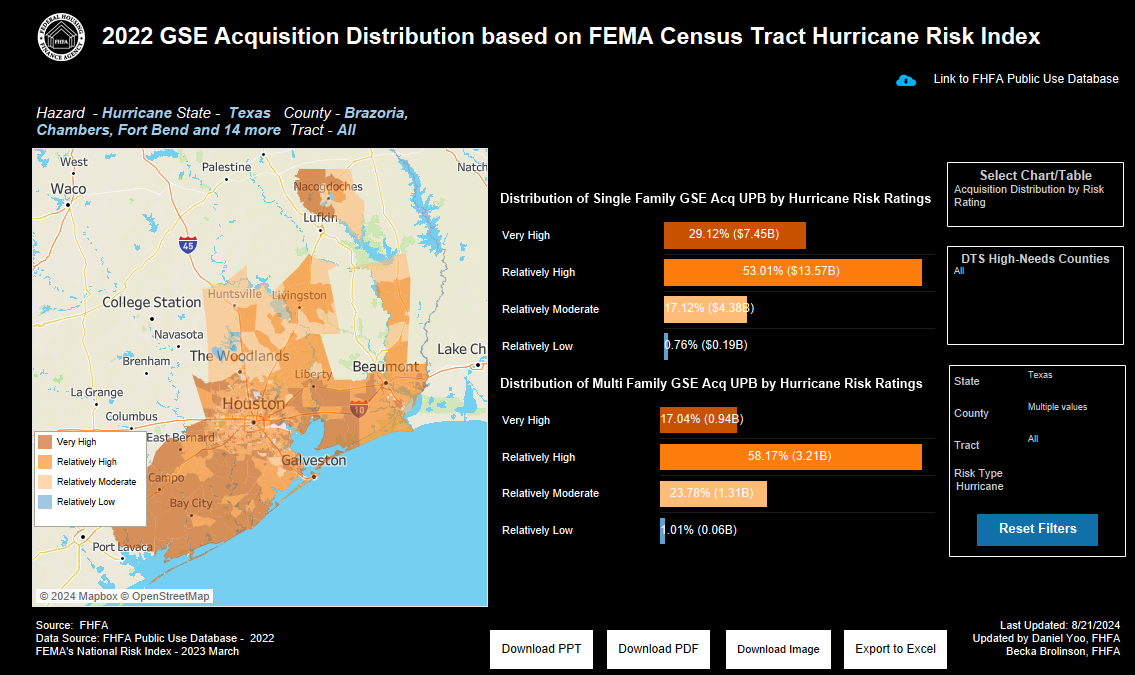
Figure 4: Distribution of Hurricane Risk for Acquired UPB in Texas in Counties Eligible for Individual Assistance
In the dashboard, users can evaluate the distribution of acquired UPB and hurricane risk in the state of Texas versus the counties with the presidential disaster declaration. In 2022, the Enterprises and the FHLBanks acquired 356,786 single-family loans in Texas for a total of approximately $105.4 billion in acquired UPB.[10] Figure 3 shows the distribution of 2022 acquired single-family UPB in Texas by hurricane risk. By the NRI ratings for hurricanes, 22.47 percent of acquired single-family UPB in the state was in either very-high or relatively-high-risk census tracts.
Figure 4 shows the distribution of risk in the 17 counties eligible for individual assistance. In these counties, 82.13 percent of acquired single-family UPB was in very-high or relatively-high-risk census tracts. Historically these locations near the Gulf Coast have experienced more hurricanes than counties further inland in the state. As a result, these counties tend to have higher exposure to hurricane risk.
By using the “National Risk Index Chart,” users can compare how hurricane risk in Texas in the NRI compares to hurricane risk in the United States overall. The average national hurricane risk in the NRI is 50.0 and the average for Texas is 56.2, suggesting that relative to all other tracts in the country, Texas contains tracts that are on average, just above the median risk.
Disaster Assistance
Fannie Mae and Freddie Mac have resources to help borrowers impacted by natural disasters. If your mortgage is backed by either Fannie Mae or Freddie Mac and your ability to repay your mortgage has been affected by a disaster, please see more information here about ways to get help.
[1]Learn more and download FEMA’s NRI here.
[2]Learn more about FHFA’s Duty to Serve high-needs rural areas designations and the FHFA Duty to Serve data here.
[3]See NOAA website here
[4]See NOAA article on 2024 Hurricane Season here.
[5]See page 196 of the NRI’s technical documentation here for more details.
[6]See page 206 of the same document in footnote 6.
[7]See page 210 of the same document in footnote 6.
[8]The data in the dashboard represent the complete merged dataset. Some census tracts in the PUDB are not represented in the NRI, thus estimates of acquisitions and UPB will be slight underestimates.
[9]See National Hurricane Center report on Hurricane Beryl’s landing here.
[10]This estimate was calculated using the “Acquisition” tab in the dashboard and selecting Texas from the state drop down menu.