Summary Statistics From FHFA’s Multifamily Public Use Databases
In 2022 and 2023, Fannie Mae and Freddie Mac (the Enterprises) financed more multifamily properties in the Northeast, Florida, Texas, and California than elsewhere in the contiguous United States. The Enterprises’ financing of multifamily properties was concentrated in low-income and minority census tracts where median incomes are lower and minority population percentages are higher than those in the corresponding Metropolitan Statistical Areas (MSAs).
Introduction
The Federal Housing Finance Agency (FHFA) releases the Public Use Databases (PUDB[1]) annually each fall. This blog uses the 2022 and 2023 PUDB to explore the Enterprises’ acquisitions of mortgage loans collateralized by multifamily housing, which consists of traditional apartments; senior, student, and military housing; and all other types of residential buildings containing five or more units where occupants rent, rather than own, their units.
Geographic Overview
The multifamily PUDB are property-level files. That is, each record represents a multifamily property backing an Enterprise-financed multifamily loan.[2] Fannie Mae acquired $64.9 billion in multifamily mortgage loans in 2022. The 2023 figure was $49.0 billion, reflecting a significant decline in its multifamily business, in part due to increasing interest rates. Likewise, Freddie Mac acquired $68.6 billion in multifamily mortgage loans in 2022. The 2023 figure was $44.5 billion.
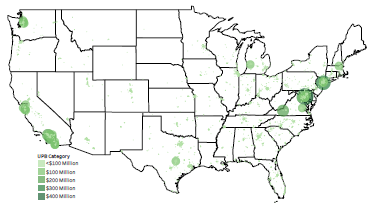
Figure 1 shows Fannie Mae’s 2022 and 2023 multifamily loan acquisitions, respectively, collateralized by properties located in each state.
Figure 1. Fannie Mae’s Acquisitions of Multifamily Mortgages in 2022 (left) and 2023 (right) by State.
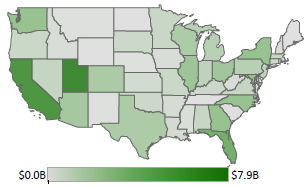
Source: FHFA, Public Use Database
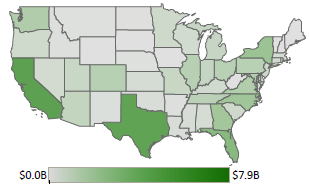
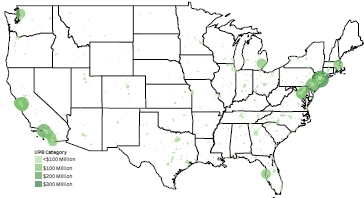
Likewise, Figure 2 shows the same information for Freddie Mac. In both years and for both Enterprises, acquisitions are concentrated in the Northeast, Florida, Texas, and California.
Figure 2. Freddie Mac’s Acquisitions of Multifamily Mortgages in 2022 (left) and 2023 (right) by State.
Source: FHFA, Public Use Database
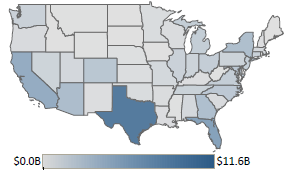
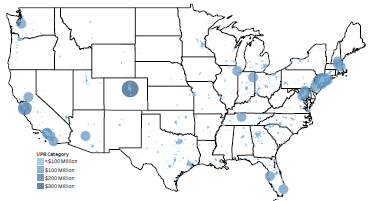
Figure 3 shows the property locations underlying Fannie Mae’s acquisitions of multifamily mortgages in 2022 and 2023, respectively, by 2020 census tract.[3]
Figure 3. Fannie Mae’s Acquisitions of Multifamily Mortgages in 2022 (left) and 2023 (right) by Census Tract.
Source: FHFA, Public Use Database
The more granular geographic detail shows that loans acquired in the Northeast are primarily along the coast from Washington, D.C. to New York City, while those in California are primarily in Los Angeles and San Francisco. The largest loan in 2022 was in Greenbelt, Maryland ($490 million); the largest loan in 2023 was in Brooklyn, New York ($348 million).
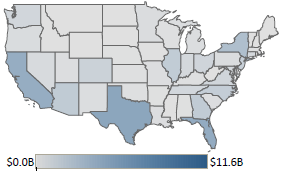
Figure 4 shows the same information for Freddie Mac. While multifamily financing also was significant in the Northeast, Florida, Texas, and California, Freddie Mac had more geographic diversification in the Midwest, particularly in 2022. The largest loan in 2022 was in Denver, Colorado ($354 million); the largest loan in 2023 was in Los Angeles, California ($947 million).
Figure 4. Freddie Mac’s Acquisitions of Multifamily Mortgages in 2022 (left) and 2023 (right) by Census Tract.
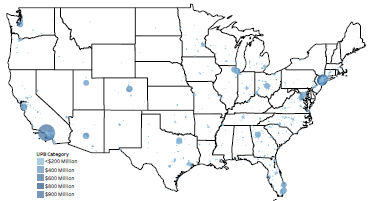
Source: FHFA, Public Use Database
Relative Income
The PUDB multifamily files also contain three fields related to median income:
- The median income in each census tract where properties collateralizing Enterprise-financed mortgages are located,
- The median income in the MSA where each tract resides, and
- The ratio of the former to the latter.
The tract income ratio field represents whether the median income in a census tract (a much smaller geography than an MSA) is above or below the median income in the corresponding MSA, and by how much. Figure 5 averages this information by state.
Figure 5. State Averages of Tract Income Ratio for Fannie Mae (top) and Freddie Mac (bottom)
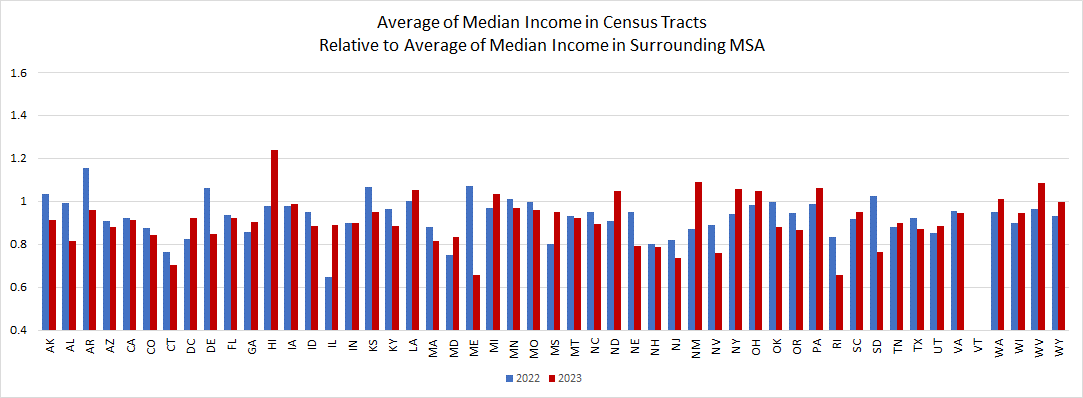
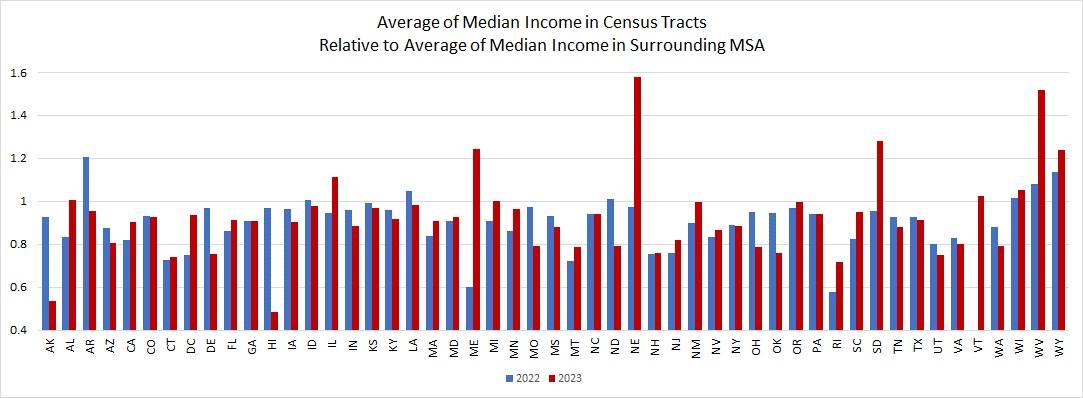
Source: FHFA, Public Use Database
In 2022 and 2023, respectively, for Fannie Mae, 42 and 40 states had tract income ratios below 1.00, which indicates that the median income in the census tracts where Fannie Mae financed multifamily loans was lower than that of the corresponding MSAs. The same is true for Freddie Mac in 43 and 41 states in 2022 and 2023, respectively. Tract income ratios were as low as 0.65 (2022, Illinois) and 0.66 (2023, Rhode Island) for Fannie Mae and 0.58 (2022, Rhode Island) and 0.48 (2023, Hawaii) for Freddie Mac. This suggests that Enterprise acquisitions typically have been concentrated in lower-income areas.
For the handful of states where census tract median incomes surpassed those of the corresponding MSAs, the highest tract income ratio was 1.58 for Freddie Mac in 2023 in Nebraska, where the census tract median income was $145,855 while that of the corresponding MSA was $92,519.
Minority Populations
The multifamily PUDB also contains the minority population percentage in each census tract.[4] Figure 6 shows the minority population percentages in the census tracts where Fannie Mae (top) and Freddie Mac (bottom) did business in 2022 and 2023, averaged by state. Minority population percentages exceeded 50 percent in 19 states (2022) and 20 states (2023) at both Enterprises.
In the states where each Enterprise did the most business in both years, average tract minority population percentages exceeded 50 percent. In 2022 and 2023, both Enterprises had average tract minority population percentages exceeding 50 percent in the Northeast (for example, in New York, 55.44 and 52.54 percent for Fannie Mae in 2022 and 2023, respectively, and 57.28 and 71.33 percent for Freddie Mac in 2022 and 2023, respectively). In California, those figures were 65.91 percent (Fannie Mae) and 73.78 percent (Freddie Mac) in 2022, and 69.57 percent (Fannie Mae) and 67.61 percent (Freddie Mac) in 2023.
Figure 6. State Averages of Tract Minority Population Percentage for Fannie Mae (top) and Freddie Mac (bottom)
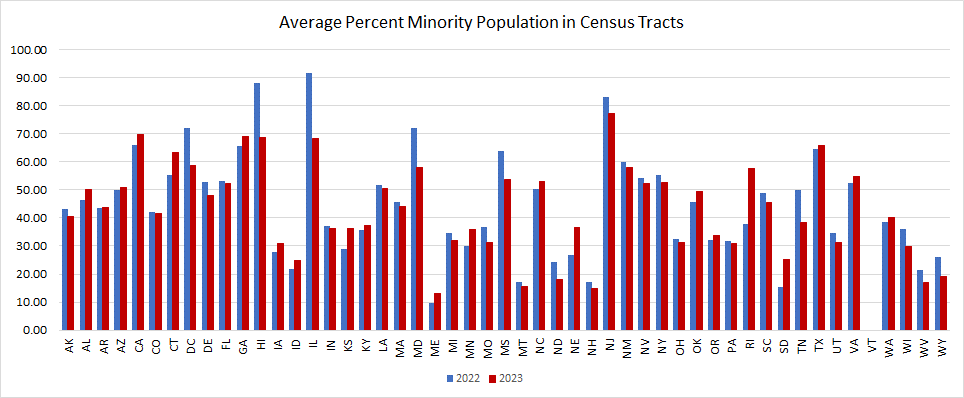
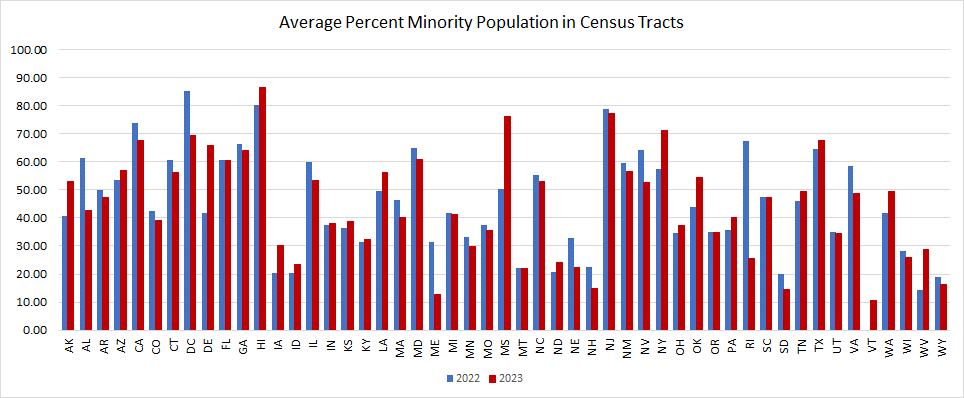
Source: FHFA, Public Use Database
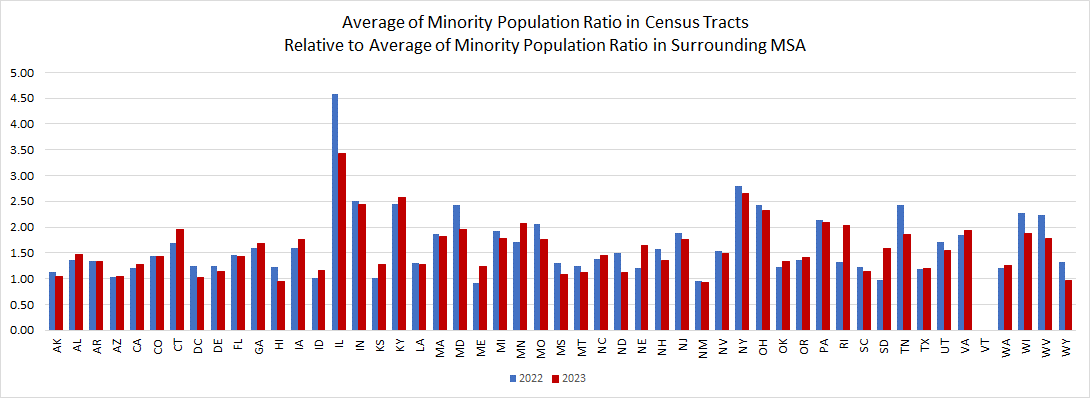
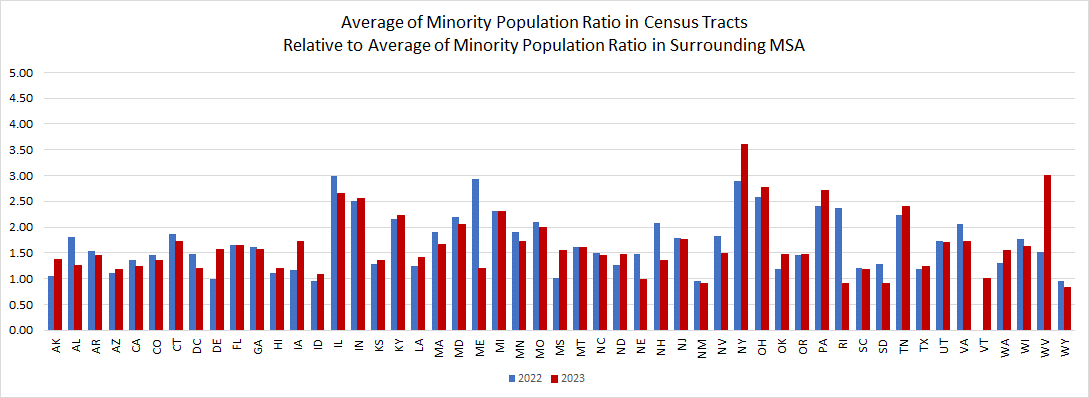
The tract percent minority population field in the multifamily PUDB is analogous to the numerator in the tract income ratio field (the median income in each census tract where properties collateralizing Enterprise-financed mortgages are located). The PUDB does not, however, include a denominator similar to the denominator in the tract income ratio field (the median income in each MSA where each tract resides). Therefore, in order to ascertain whether the minority population percentage in a census tract is above or below the minority population percentage in the corresponding MSA and by how much, data external to the PUDB are required. The U.S. Census Bureau is the source of such data.[5] Dividing the former by the latter yields tract minority population percentage ratios, shown in Figure 7 (Fannie Mae top; Freddie Mac bottom).
Tract minority population percentage ratios exceeded 1.00 in 47 states in both years (Fannie Mae) and in 46 and 45 states, respectively, for 2022 and 2023 for Freddie Mac. So, although average tract minority population percentages were greater than 50 percent in only roughly 20 states at both Enterprises in both years, the census tracts where they did business had higher tract minority population percentages than their corresponding MSAs in nearly every state in both years. Fannie Mae’s average tract minority population percentage ratios were highest in both years at 4.59 (2022) and 3.42 (2023) in Illinois, while Freddie Mac’s were highest at 2.99 (Illinois in 2022) and 3.61 (New York in 2023). Coupled with the findings for tract income ratio, the data illustrate that Enterprise multifamily acquisitions in 2022 and 2023 were primarily concentrated in low-income areas and in areas with higher minority population shares.
Figure 7. State Averages of Tract Minority Population Percentage Ratio for Fannie Mae (top) and Freddie Mac (bottom)
Source: FHFA, Public Use Database
Additional Information
Additional information on Enterprise purchases can be accessed at www.fhfa.gov. Fannie Mae and Freddie Mac also produce their own public use data.[6] The Enterprises do not focus those databases on acquisition/purchase volume, but rather update them quarterly based on performance data of multifamily loans outstanding at a given point in time. Because loan numbers and other information are proprietary, the PUDB cannot be joined with data published by the Enterprises; however, users can tie geographic information to census or other data for economic or demographic analysis.
[1] https://www.fhfa.gov/data/public-use-database-fannie-mae-and-freddie-mac.
[2] In the multifamily market, one loan can be collateralized by many properties in one geographic locality or in disparate localities. The acquisition unpaid principal balance field in the PUDB is defined as “the UPB when the Enterprise acquired the mortgage. The UPB is reported as the midpoint for the $10,000 interval into which the reported value falls to conform with Consumer Financial Protection Bureau Privacy Guidance.” As a result, data here do not match Enterprise published financials exactly.
[3] The PUDB does not contain latitude and longitude of properties collateralizing Enterprise loans; a crosswalk can match each census tract to the latitude and longitude of its center (centroid).
[4] The PUDB defines percent minority as the “percentage of the census tract’s population that is classified as belonging to a minority group, based on the 2020 decennial census. See definition of Minority in 12 CFR 1282.1.” .
[6] https://mf.freddiemac.com/investors/data and https://capitalmarkets.fanniemae.com/credit-risk-transfer/multifamily-credit-risk-transfer/multifamily-loan-performance-data.