Are students willing to endure long commutes for access to good schools? Little is known about how much families are willing to let students travel between home and school, especially if they have an opportunity to attend one of the best public schools. In a FHFA working paper, we show that for even the best high schools in New York State, the likelihood a teenager applies drops off precipitously as commute times increase. This blogpost highlights several aspects about how housing can affect educational pursuits.
School access is a popular topic, but proximity to schools could be equally important. Even if all students could have unconstrained choice about where to attend high school, would they be willing to travel enough for it to matter? For many students, the answer seems to be “no”. Longer commutes lead to vastly lower likelihoods of applying to even the best public schools. If families cannot afford to live near good schools, their children could be shut out of them, even if they are notionally welcome to apply.
We match student-level administrative data from New York City with commuting times and modes from Google’s transit directions service. The student data includes application preferences for the city’s highly selective Specialized High Schools, which allows us to evaluate how students’ likelihood of applying to an elite school is related to their commute. By law, the only admissions criterion is a student’s score on an admissions exam taken in eighth grade. In terms of school quality, the schools range from Stuyvesant – whose students have the best average SAT scores in the state – to Brooklyn Tech – with students scoring in the top 1%. That is, they are all highly selective. Students apply to these schools by taking the entrance exam and listing their preferences for a particular school.
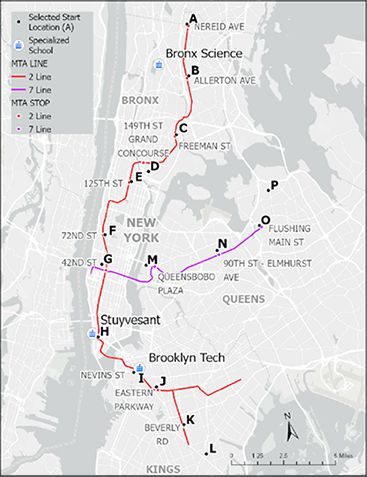
The map in Figure 1 provides a visualization of how students living at different locations (the black dots with letters next to them might compare subway journeys (the colored lines indicate the closest subway line/station) when deciding whether to apply to one of the top three specialized schools (noted by a school building image inside a circle). One might expect students to apply to the best schools even if they are located farther away because of the educational prestige. However, transportation is a large disincentive as we show next.
Figure 1: Example Map of How Students Might Get to the Top 3 Schools
Decision-making is formally captured in Table 1. Baseline estimates from a discrete choice model compare where a student might want to attend, how long it might take to travel, and whether the number of transfers is a deterrence. Column A presents the coefficients from a logit discrete choice model for each school. To translate those numbers into practical examples, column B indicates how much more likely a student who lives 20 minutes away from the school in question is to apply than an identical student who lives 40 minutes away. For instance, a student who lives close to Stuyvesant is 73% more likely to apply than an exactly equivalent student who lives farther away. The table also reports cross effects (e.g., you are less likely to apply to Stuyvesant if you live closer to Bronx Science): a student who lives 20 minutes away from Brooklyn Tech is 10% less likely to apply to Stuyvesant than one who lives 40 minutes from Brooklyn Tech. The own-school effects are strongest.
Table 1: First Choice Results
| Stuyvesant | Bronx | Brooklyn | ||||
|---|---|---|---|---|---|---|
| (A) | (B) | (A) | (B) | (A) | (B) | |
| Stuyvesant Travel Time | -1.644 (0.050) |
+73% | -1.917 (0.065) |
+89% | 0.300 (0.067) |
-10% |
| Bronx Travel Time | 0.315 (0.021) |
-10% | -1.794 (0.023) |
+82% | 1.189 (0.028) |
-33% |
| Brooklyn Travel Time | 0.301 (0.046) |
-10% | 2.842 (0.051) |
-61% | -2.598 (0.063) |
+138% |
| Stuyvesant Transfers | 0.039 (0.008) |
-4% | 0.386 (0.009) |
-32% | -0.200 (0.011) |
+22% |
| Bronx Transfers | 0.102 (0.009) |
-10% | 0.335 (0.011) |
-28% | -0.194 (0.013) |
+21% |
| Brooklyn Transfers | 0.067 (0.009) |
-6% | 0.194 (0.010) |
-18% | 0.038 (0.012) |
-4% |
Instead of looking at options based on residential location, if we move students about the city, how does their probability of applying to each school change? We can use the map above and compute how probabilities differ. For instance, students are about 3 times more likely to apply to Stuyvesant if they lives at point F as opposed to the farther away point B. A full set of comparisons from the various points and each of the top three schools is available in the paper.
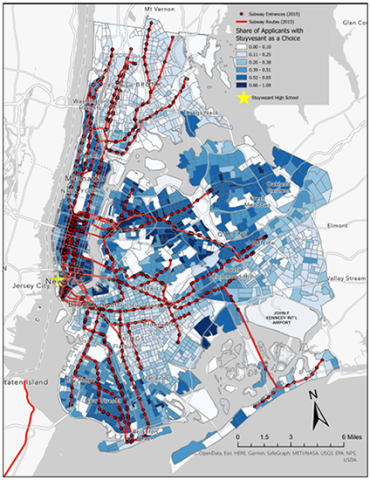
We can perform a similar exercise with many more subway and bus routes to show a complete visualization across the city. Figure 2 maps the share of students by Census tract who apply to Stuyvesant. The share of students in a tract applying to the top school tends to increase as one gets closer to that school. The shares are higher (darker blue colors) when a residential location is closer to a public transit option, particularly ones that have a quicker or more direct route to the school.
Figure 2: Applications by Location for Stuyvesant
Since our analysis is for students taking the Specialized High School entrance exam, we are looking at a subset of students motivated enough to take an extra test. Given the New York City setting, they also have access to an extensive public transit network to reach schools across the city. Thus, we should expect them to have a relatively high willingness and ability to commute. Even in this setting, the likelihood of applying to highly ranked schools drops dramatically as commuting time increases. To be clear, the results do not convey school choice is unimportant, but that the effect of residential location looms quite large. The ability to commute to good schools is not a substitute for residential access to good neighborhoods. Many students are not willing to even apply to top schools when they are not close to home.
By: Lawrence Costa
Senior Economist
Division of Research and Statistics
Tagged: FHFA Stats Blog; Source: FHFA