More than two-thirds of home appraisals associated with Enterprise-backed mortgages during the 2013-2021 period included five or more comparable properties, even though the Enterprises only require three comparables. However, the share of appraisals with five or more comparable properties decreased from 76 percent in 2013 to 59 percent in 2021, a drop of 17 percentage points. That share differed considerably across states during the 2013-2021 period, ranging from 34 percent in Mississippi to 90 percent in California, and was 13 percentage points lower in rural areas than in high-density urban areas.
For most single-family mortgages they acquire, Fannie Mae and Freddie Mac (the Enterprises) require lenders to obtain an appraisal from a state-certified or state-licensed appraiser that accurately reflects the market value, condition, and marketability of the property.[1] Appraisers are responsible for selecting comparable properties ("comps") that are most similar to the subject property in legal and physical characteristics, adjusting for differences in market and reconciling the adjusted sale prices of the comps to a final estimate of value (sales comparison approach).[2]
The Enterprises require that mortgages sold to them include at least three settled comps—which are comps for properties that transacted—in the corresponding home appraisal reports. This blog is the first in a series that will analyze comps in appraisal reports, using the Uniform Appraisal Dataset Appraisal-Level Public Use File (UAD PUF), and provide preliminary descriptive analysis.[3]
In October 2023, the Federal Housing Finance Agency (FHFA) released the UAD PUF, the nation’s first publicly available appraisal-level dataset of appraisal records. It is based on a 5 percent nationally representative random sample of appraisals from 2013 through 2021 for single-family mortgages acquired by the Enterprises and includes selected information on comps.
Total Number of Comps
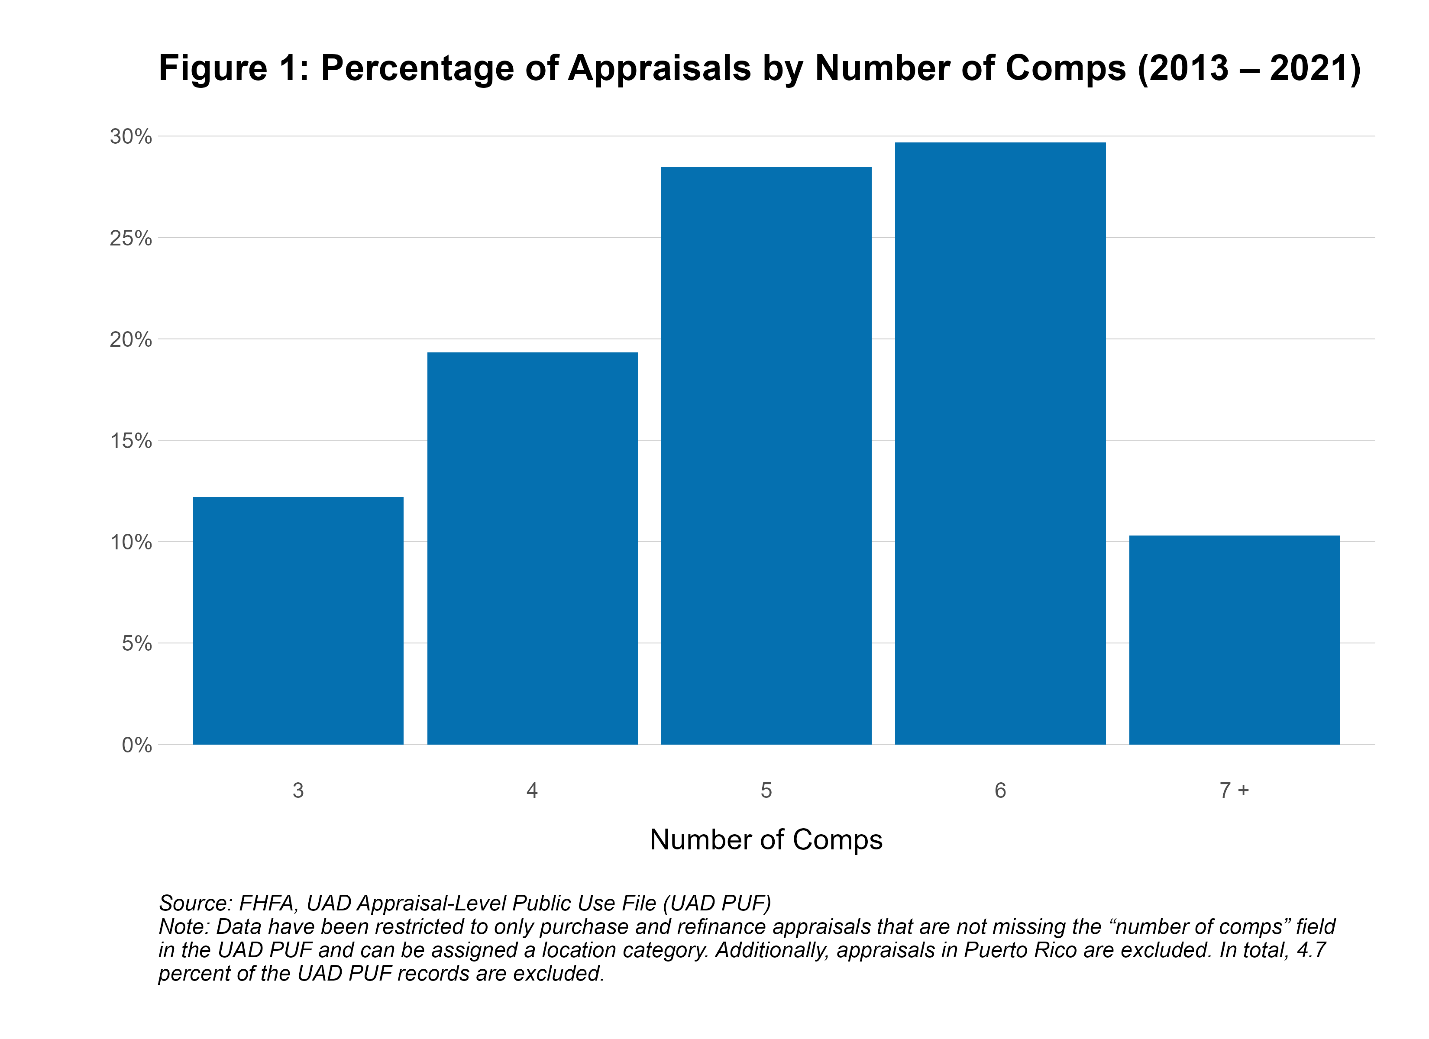
Figure 1 represents the distribution of appraisals by the total number of comps reported in appraisals from 2013 to 2021 for mortgages acquired by the Enterprises. All appraisals included at least three comps, the minimum number required by the Enterprises, and most appraisals (about 87 percent) exceeded three comps. The distribution is as follows: about 13 percent of appraisals included exactly three comps, about 19 percent included four comps, and more than two-thirds (about 68 percent) included five or more comps—specifically, about 28 percent of the appraisals included five comps, about 29 percent included six comps, and about 10 percent included seven or more comps. During this period, the average and median number of comps per appraisal was five and the modal number of comps per appraisal was six.

Number of Comps Over Time
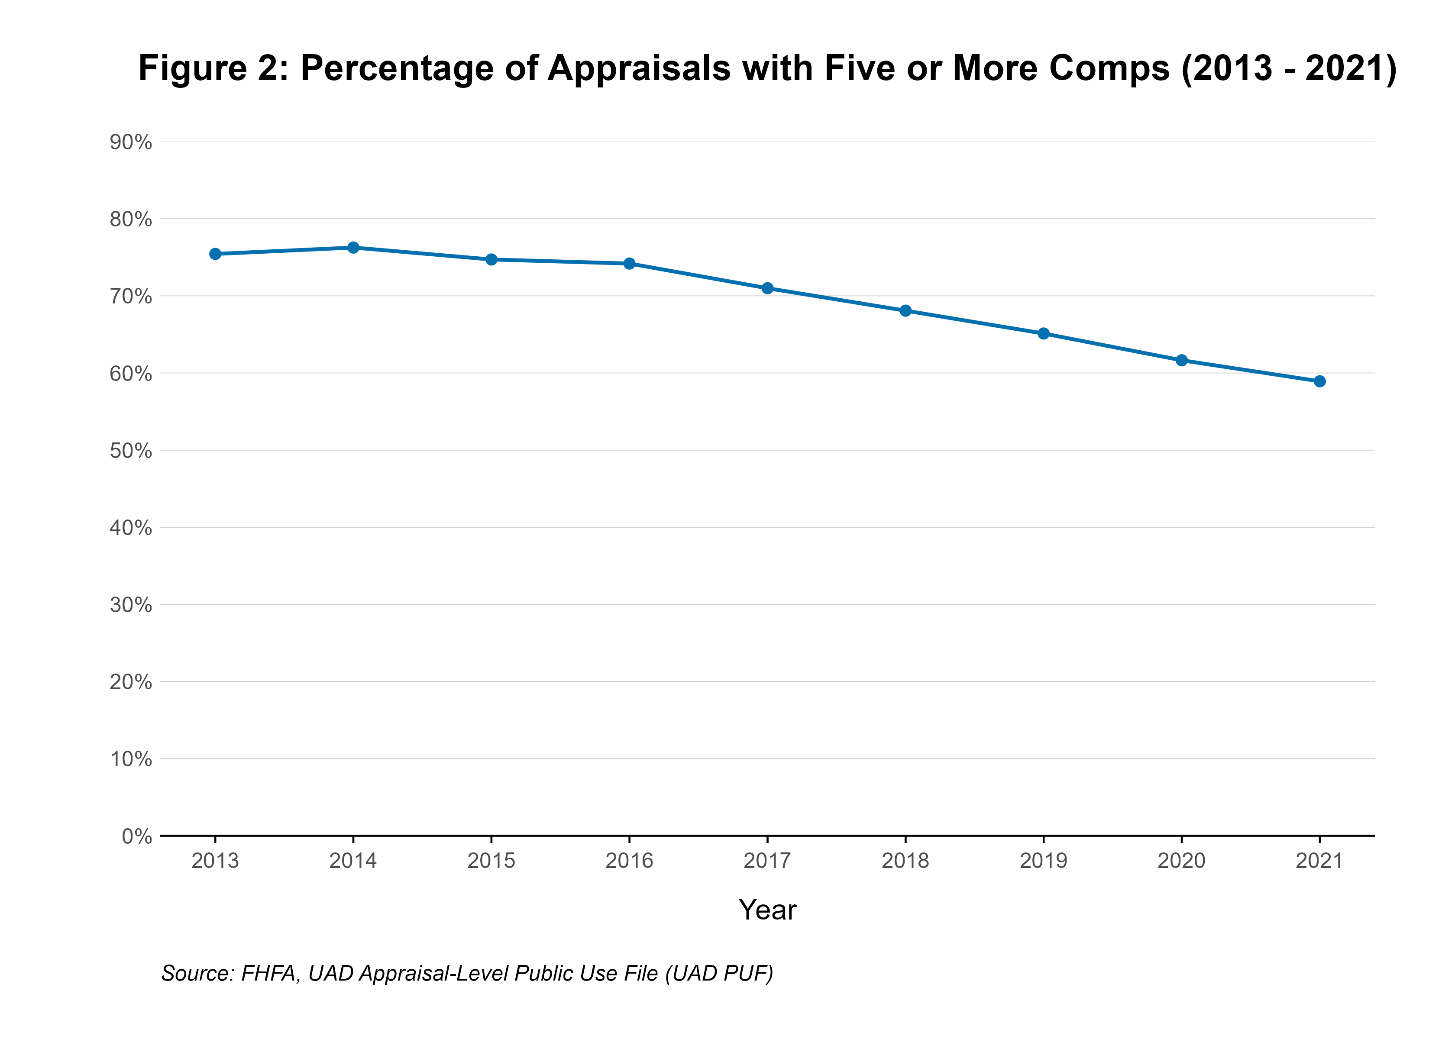
Figure 2 represents the trend in the percentage of appraisals with five or more comps from 2013 to 2021. Since 2014, the percentage of appraisals with five or more comps has decreased consistently.[4] Between 2016 and 2021, there was about a 3 percentage point year-over-year decrease in the share of appraisals with five or more comps. In 2021, the percentage of appraisals with five or more comps dropped below 60 percent, down about 17 percentage points compared to 2013. This decrease could be related to changes in the appraisal industry and market practices during this 9-year period, but additional analysis is needed to determine the cause of the decline.

Number of Comps by State
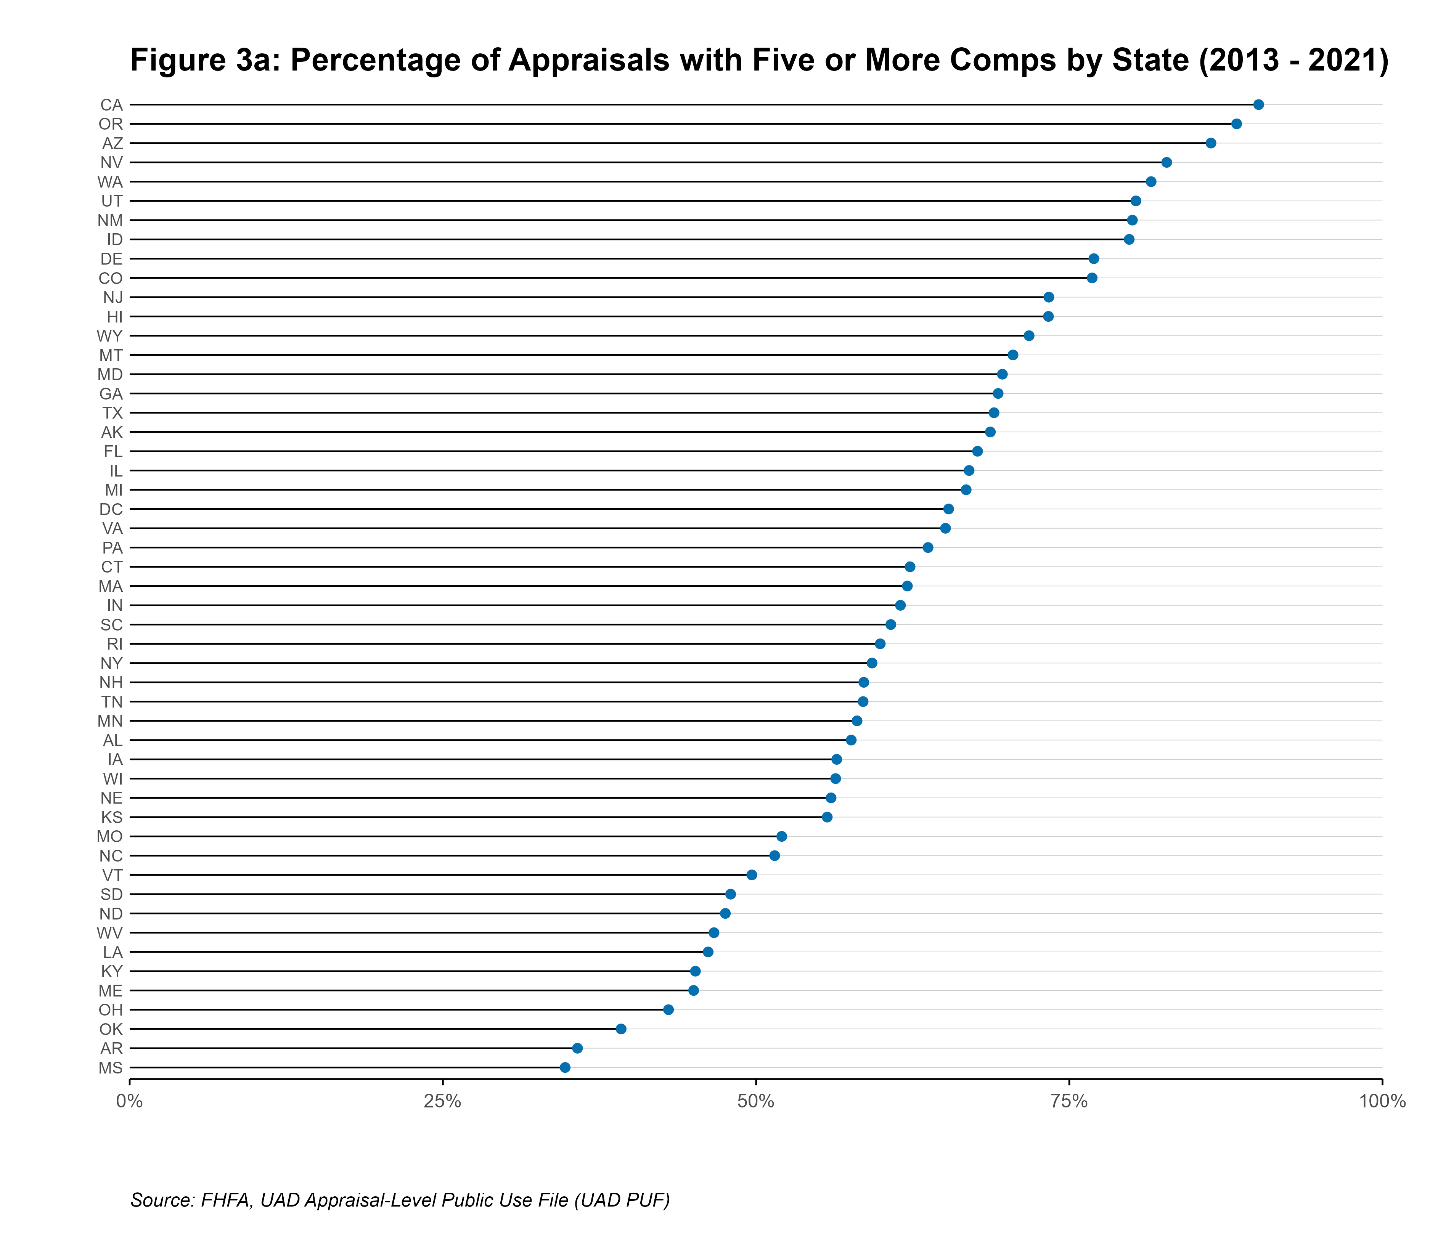
Figures 3a and 3b show each state's share of appraisals with five or more comps in rank order and map format for the 2013 to 2021 period. The shares varied greatly across states, suggesting a level of geographic differences in appraisals. There are 10 states in which over 75 percent of the state’s appraisals included five or more comps. For 39 states and the District of Columbia, over half of appraisals in those states contained five or more comps. The western region of the country has the highest share of appraisals with five or more comps, with California, Oregon, and Arizona as the states with the highest shares. States in the south such as Mississippi, Arkansas, and Oklahoma accounted for the fewest percentage of appraisals with five or more comps. This pattern remained relatively consistent over time, although some states shifted a few spots in the rank order from year to year.

.png)
Number of Comps: Urban vs. Rural
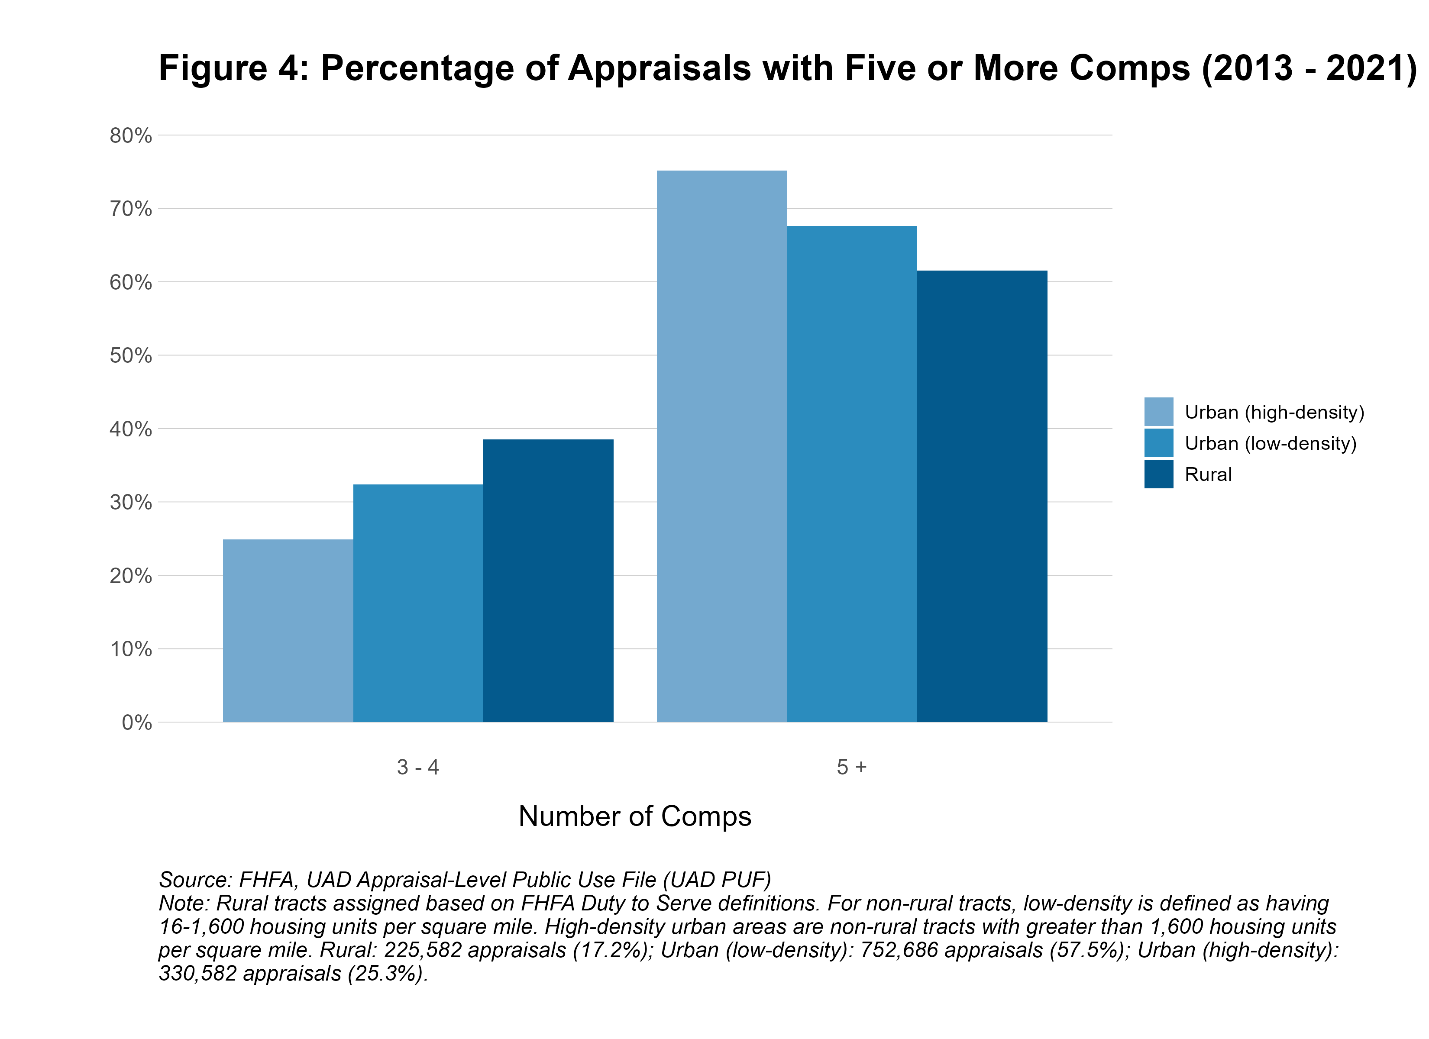
Figure 4 shows how the number of comps varied for appraisals across urban and rural areas during the 2013 to 2021 period. Rural areas are identified using the FHFA Duty to Serve Program definition.[5] Identification of high- and low-density urban areas closely follows the Housing Assistance Council’s designation based on the number of housing units per square mile.[6] In high-density urban areas, about 75 percent of appraisals included five or more comps. That number dropped to about 67 percent for appraisals in low-density urban areas. In rural areas, less than 61 percent of appraisals included five or more comps. This represents a consistent decrease in the number of comps included in home appraisals as the appraised properties move from high-density urban areas to rural areas, suggesting a link between the number of comps per appraisal and the density of the location.

Summary
Real estate comps are a critical part of the home appraisal process and are the key input to the sales comparison approach. While appraisers have discretion to include the most similar comps in the appraisal report and retain other considered sales data in their work files, the number of comps included in an appraisal report may be indicative of the amount of sales data available to an appraiser. Furthermore, the number and variability of unique property characteristics may influence the number of comps included in an appraisal report.
This analysis indicates that there are significant differences in the total number of comps that appraisers include in appraisal reports over time, across states, and by density of the location. Appraisal reports often exceed the minimum number of required comps, and most include at least five or more comps. However, the share of appraisals with five or more comps decreased considerably from 2013 to 2021. Location density appears to be related to the number of comps, with rural areas and southern states having fewer comps than urban areas and western states. Additional analysis is required to explore these factors and relationships. The next blog in this series will analyze proximity of comps to the subject property.
Further Data Exploration
An interactive Tableau dashboard can be used for further data exploration as a companion tool to this blog.
References:
1 Selling Guide – Fannie Mae Single Family: Section B4-1.1-02, Lender Responsibilities (Published May 1, 2024). Freddie Mac Single-Family Seller/Servicer Guide: Section 5605.1, Appraisal Report Requirements, Property Description and Analysis (Published May 1, 2024).
2 Selling Guide – Fannie Mae Single Family: Section B4-1.3-07, Sales Comparison Section of the Appraisal Report (Published May 1, 2024). Freddie Mac Single-Family Seller/Servicer Guide: Section 5605.6, Sales Comparison Approach (Published May 1, 2024).
3 This analysis includes all comps reported in the appraisal report, regardless of whether they are settled sales. In addition to the three settled sales, appraisers are allowed to include pending sales and active listings as part of the comps in the report.
4 This blog focuses on the percentage of appraisals with five or more comps because the average and median number of comps per appraisal during this period was 5. The trend in the percentage of appraisals with four or more comps during this period follows a similar pattern.
5 Federal Housing Finance Agency’s Duty to Serve eligibility data :
https://www.fhfa.gov/data/duty-to-serve/eligibility-data
6 Housing Assistance Council’s Rural & Small Town Typology Database: Technical Documentation. Version: HAC Tract-9 January 2014.
By: Sean Cannon
Economist
Office of Data and Statistics
Division of Research and Statistics
By: Will Fischler
Economist
Office of Data and Statistics
Division of Research and Statistics