The median appraised value for both purchase and refinance Enterprise single-family and condominium appraisals increased between the second quarters of 2023 and 2024 and the first and second quarters of 2024.
The Federal Housing Finance Agency (FHFA) published the 2024Q2 update of the Uniform Appraisal Dataset (UAD) Aggregate Statistics Data File and Dashboards on September 26, 2024.[1] For the first time, the UAD Aggregate Statistics Data File and Dashboards include Enterprise condominium appraisal data. The addition of Enterprise condominium appraisal data expands public access to appraisal data and complements the existing data for single-family homes. The Agency is a trusted and leading source of housing finance data, and publishing the UAD Aggregate Statistics provides transparency to the public. This blog presents key summary statistics on Enterprise single-family and condominium appraisals from this most recent release of the data.
National Year-over-Year and Quarter-over-Quarter Changes in Single-Family and Condominium Appraisals
Changes in the Number of Appraisals and Median Appraised Values for Single-Family Homes in the United States
In 2024Q2, as compared to the year-earlier period, the number of single-family appraisals increased 2.4 percent for purchase and refinance loans combined, 0.6 percent for purchase loans only, and 8.2 percent for refinance loans only (see Table 1). Over the same period, the median appraised value for single-family appraisals increased 3.8 percent for purchase loans and 8.4 percent for refinance loans.
Compared to the previous quarter, the number of single-family appraisals in 2024Q2 increased 25 percent for purchase and refinance loans combined, 29.4 percent for purchase loans only, and 12.7 percent for refinance loans only (see Table 1). This quarter-over-quarter increase in single-family appraisal volume is lower than the average increase of 35.6 percent for purchase loans between Q1 and Q2 since 2013. However, between 2013 and 2019, the average increase was 44.5 percent, while between 2020 and 2024 it was 23.2 percent. Therefore, the 2024Q2 increase is moderately higher than the average increase in the most recent (post-pandemic) years.[2] Finally, also compared to the previous quarter, the median appraised value increased 2.5 percent for purchase loans and 0.2 percent for refinance loans.
Table 1: Changes in Number of Enterprise Single-Family Appraisals and Median Appraised Value by Loan Purpose
| Loan Purpose for Appraisal | Statistic | 2024Q2 | 2023Q2 | Year-Over-Year Percent Change | 2024Q1 | Quarter-Over-Quarter Percent Change |
|---|---|---|---|---|---|---|
| Purchase or Refinance | Number of Appraisals | 813,598 | 794,877 | 2.4 | 651,012 | 25.0 |
| Purchase | 617,836 | 613,893 | 0.6 | 477,335 | 29.4 | |
| Refinance | 195,762 | 180,984 | 8.2 | 173,677 | 12.7 | |
| Purchase | Median Appraisal Value (Dollars) | 410,000 | 395,000 | 3.8 | 400,000 | 2.5 |
| Refinance | 401,000 | 370,000 | 8.4 | 400,000 | 0.2 |
Source: FHFA. Uniform Appraisal Dataset Aggregate Statistics
Changes in the Number of Appraisals and Median Appraised Values for Condominiums in the United States
Enterprise condominium appraisals represent a smaller number of appraisals than single-family appraisals. In 2024Q2 there were 813,598 single-family appraisals and 79,589 condominium appraisals.
In 2024Q2, as compared to the year-earlier period, the number of Enterprise condominium appraisals decreased 2.1 percent for purchase and refinance loans combined and 3.6 percent for purchase loans only, while increasing 9.5 percent for refinance loans only (see Table 2). Over the same period, the median appraised value increased 4.7 percent for purchase loans and 12.9 percent for refinance loans. Compared to the previous quarter, the number of Enterprise condominium appraisals in 2024Q2 increased 23.6 percent for purchase and refinance loans combined, 25.4 percent for purchase loans only, and 12.7 percent for refinance loans only (see Table 2). Also compared to the previous quarter, the median appraised value decreased 0.8 percent for purchase loans and increased 2.6 percent for refinance loans.
Table 2: Changes in Number of Enterprise Condominium Appraisals and Median Appraised Value by Loan Purpose
| Loan Purpose for Appraisal | Statistic | 2024Q2 | 2023Q2 | Year-Over-Year Percent Change | 2024Q1 | Quarter-Over-Quarter Percent Change |
|---|---|---|---|---|---|---|
| Purchase or Refinance | Number of Appraisals | 79,589 | 81,298 | -2.1 | 64,382 | 23.6 |
| Purchase | 69,530 | 72,115 | -3.6 | 55,458 | 25.4 | |
| Refinance | 10,059 | 9,183 | 9.5 | 8,924 | 12.7 | |
| Purchase | Median Appraisal Value (Dollars) | 357,000 | 341,000 | 4.7 | 360,000 | -0.8 |
| Refinance | 395,000 | 350,000 | 12.9 | 385,000 | 2.6 |
Source: FHFA. Uniform Appraisal Dataset Aggregate Statistics
State Year-over-Year and Quarter-over-Quarter Changes in Single-Family Appraisals
Year-Over-Year Changes in Median Appraised Values for Single-Family Purchase Appraisals (2023Q2–2024Q2)
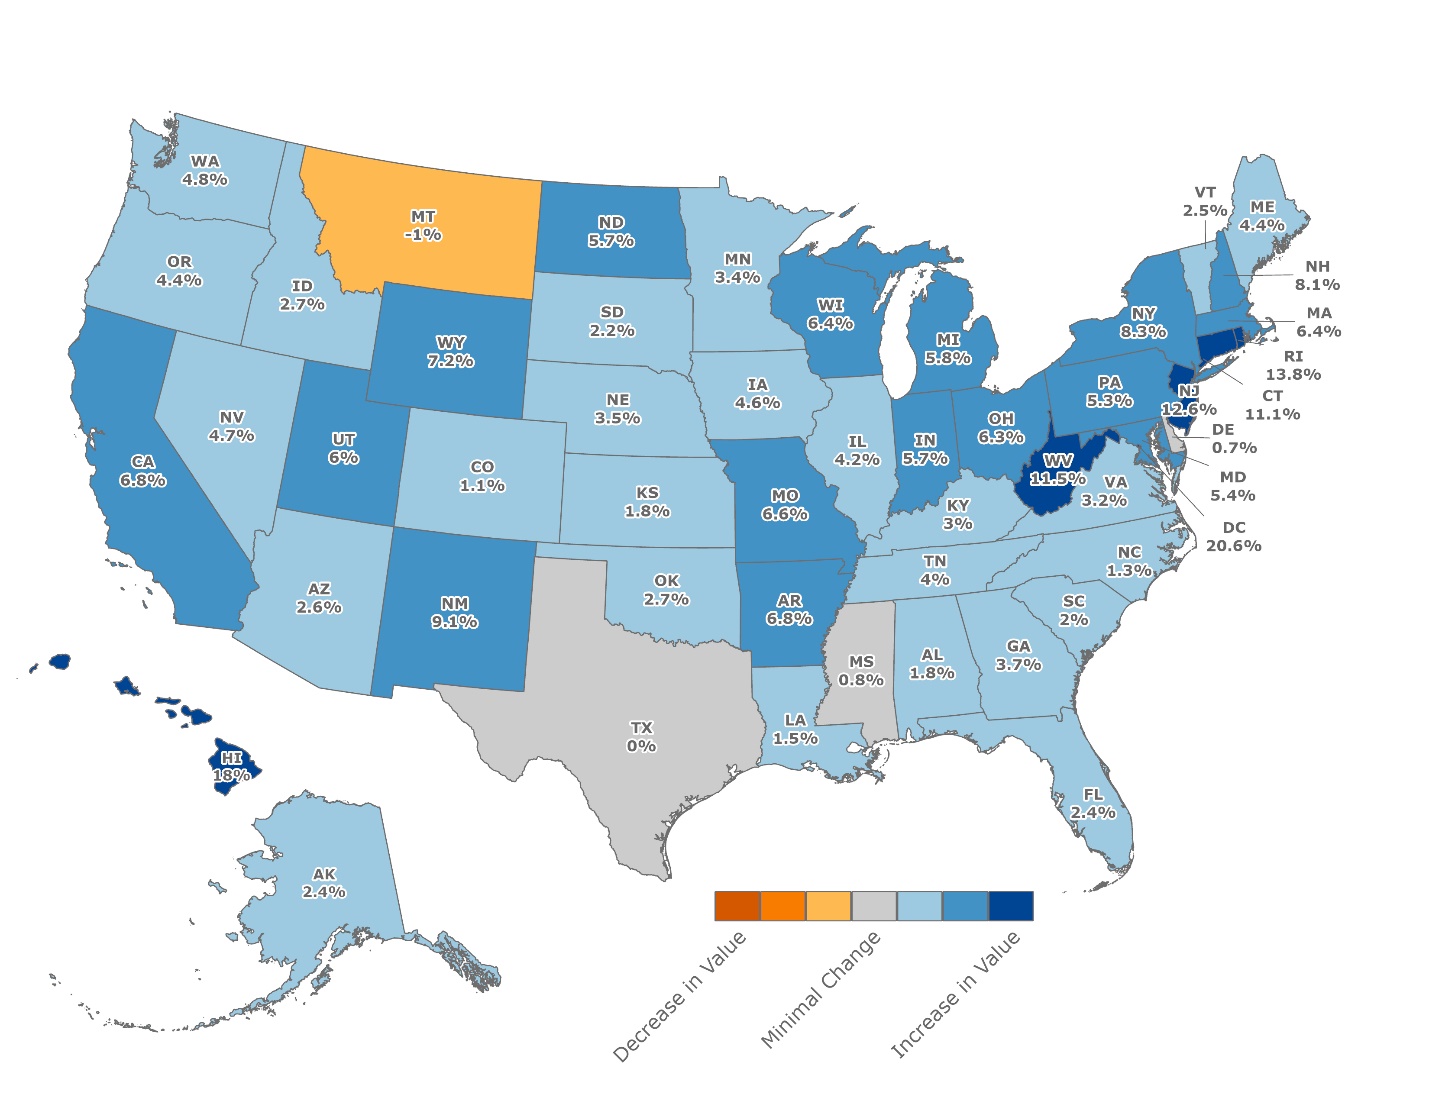
Figure 1 shows the year-over-year percent change in median appraised value for purchase appraisals for each state and the District of Columbia. Forty-eight states and the District of Columbia witnessed increases, with the largest gains in the District of Columbia, Hawaii, Rhode Island, New Jersey, and West Virginia. Montana was the only state to experience a decline, dropping 1.0 percent, with Texas witnessing no change.
Figure 1: Year-Over-Year Changes in Median Appraised Value for Purchase Loans, 2023Q2–2024Q2

Source: FHFA. Uniform Appraisal Dataset Aggregate Statistics
Year-Over-Year Changes in Median Appraised Values for Single-Family Refinance Appraisals (2023Q2–2024Q2)
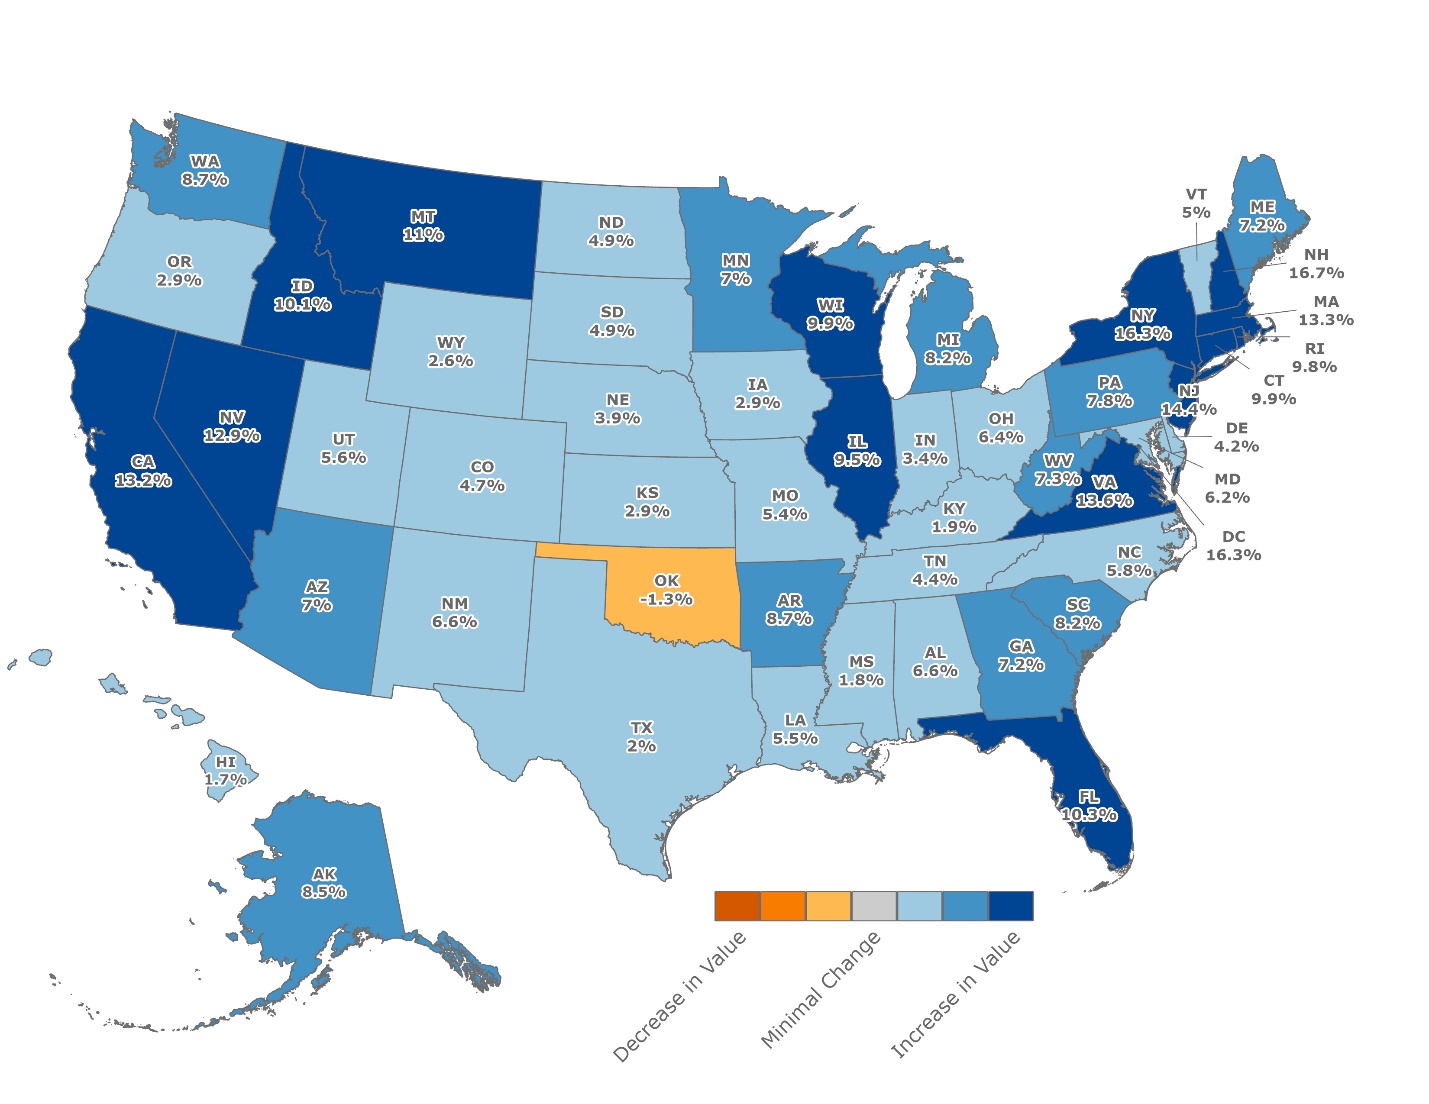
Figure 2 shows the year-over-year percent change in median appraised value for refinance appraisals for each state and the District of Columbia. Forty-nine states and the District of Columbia experienced increased median appraised values, with the largest gains in New Hampshire, the District of Columbia, New York, New Jersey, and Virginia. Only Oklahoma witnessed a decline.
Figure 2: Year-Over-Year Changes in Median Appraised Value for Refinance Loans, 2023Q2–2024Q2

Source: FHFA. Uniform Appraisal Dataset Aggregate Statistics
Quarter-Over-Quarter Changes in Median Appraised Values for Single-Family Purchase Appraisals (2024Q1-2024Q2)
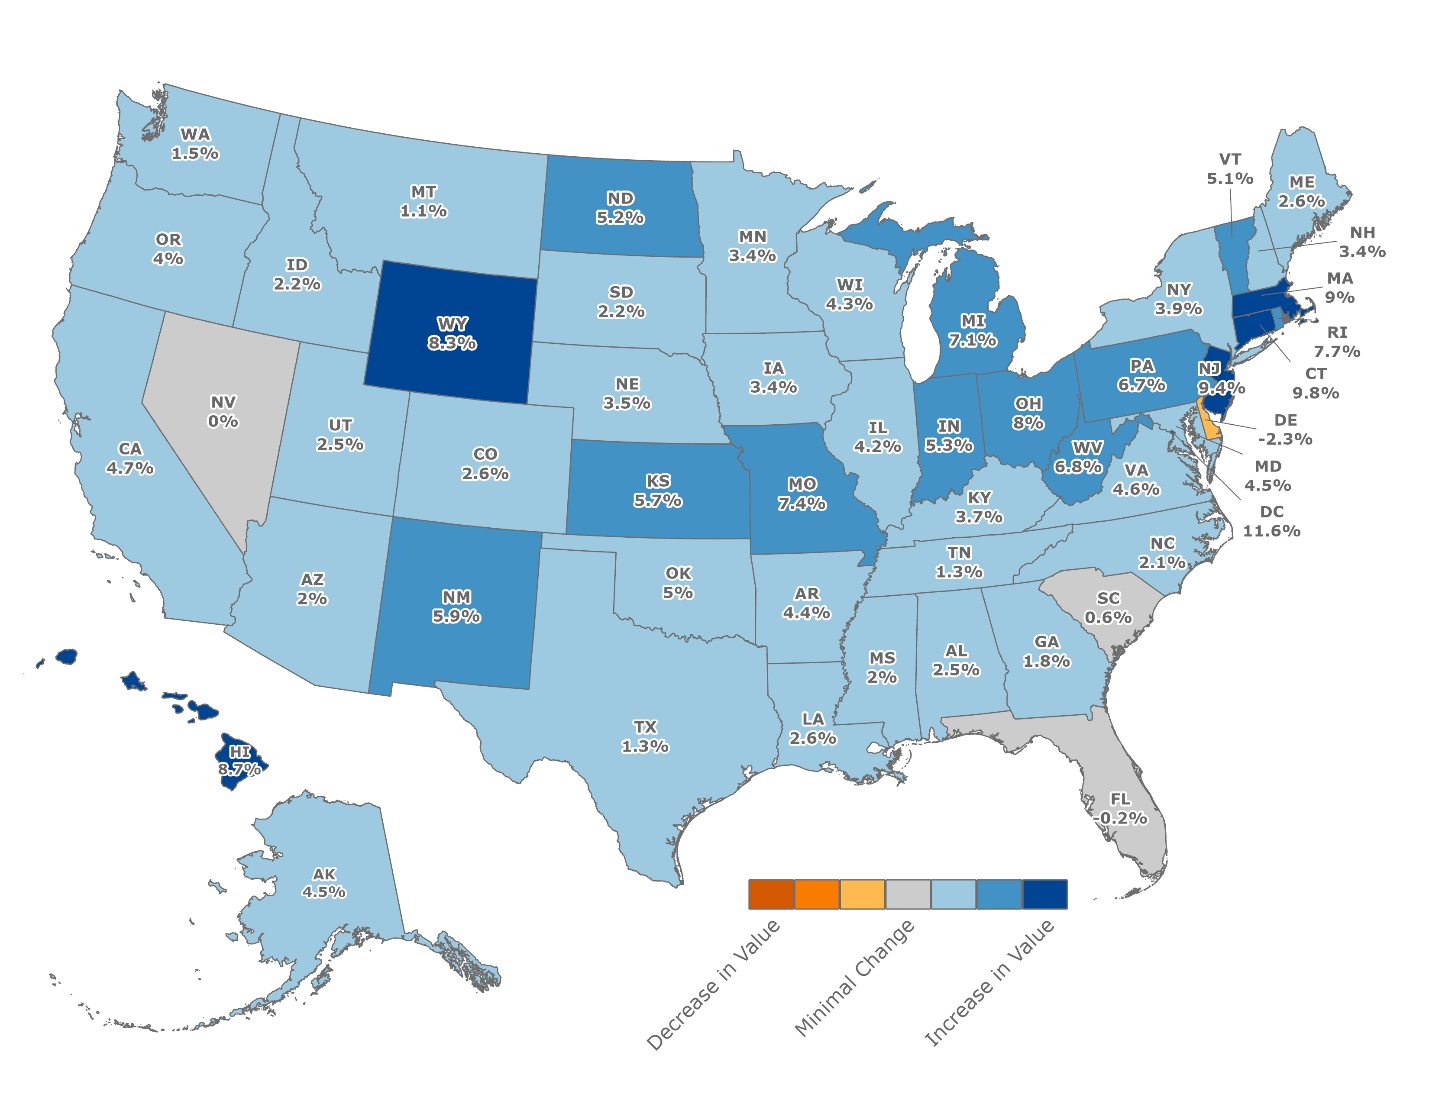
Figure 3 depicts the quarter-over-quarter percent change in median appraised value for single-family purchase appraisals for each state and the District of Columbia. Except for Delaware (down 2.3 percent), Florida (down 0.2 percent), and Nevada (no change), 47 states and the District of Columbia witnessed increases, with the largest increases in the District of Columbia, Connecticut, New Jersey, Massachusetts, and Hawaii.
Figure 3: Quarter-Over-Quarter Changes in Median Appraised Value for Single-Family Purchase Loans, 2024Q1-2024Q2

Source: FHFA. Uniform Appraisal Dataset Aggregate Statistics
Quarter-Over-Quarter Changes in Median Appraised Values for Single-Family Refinance Appraisals (2024Q1-2024Q2)
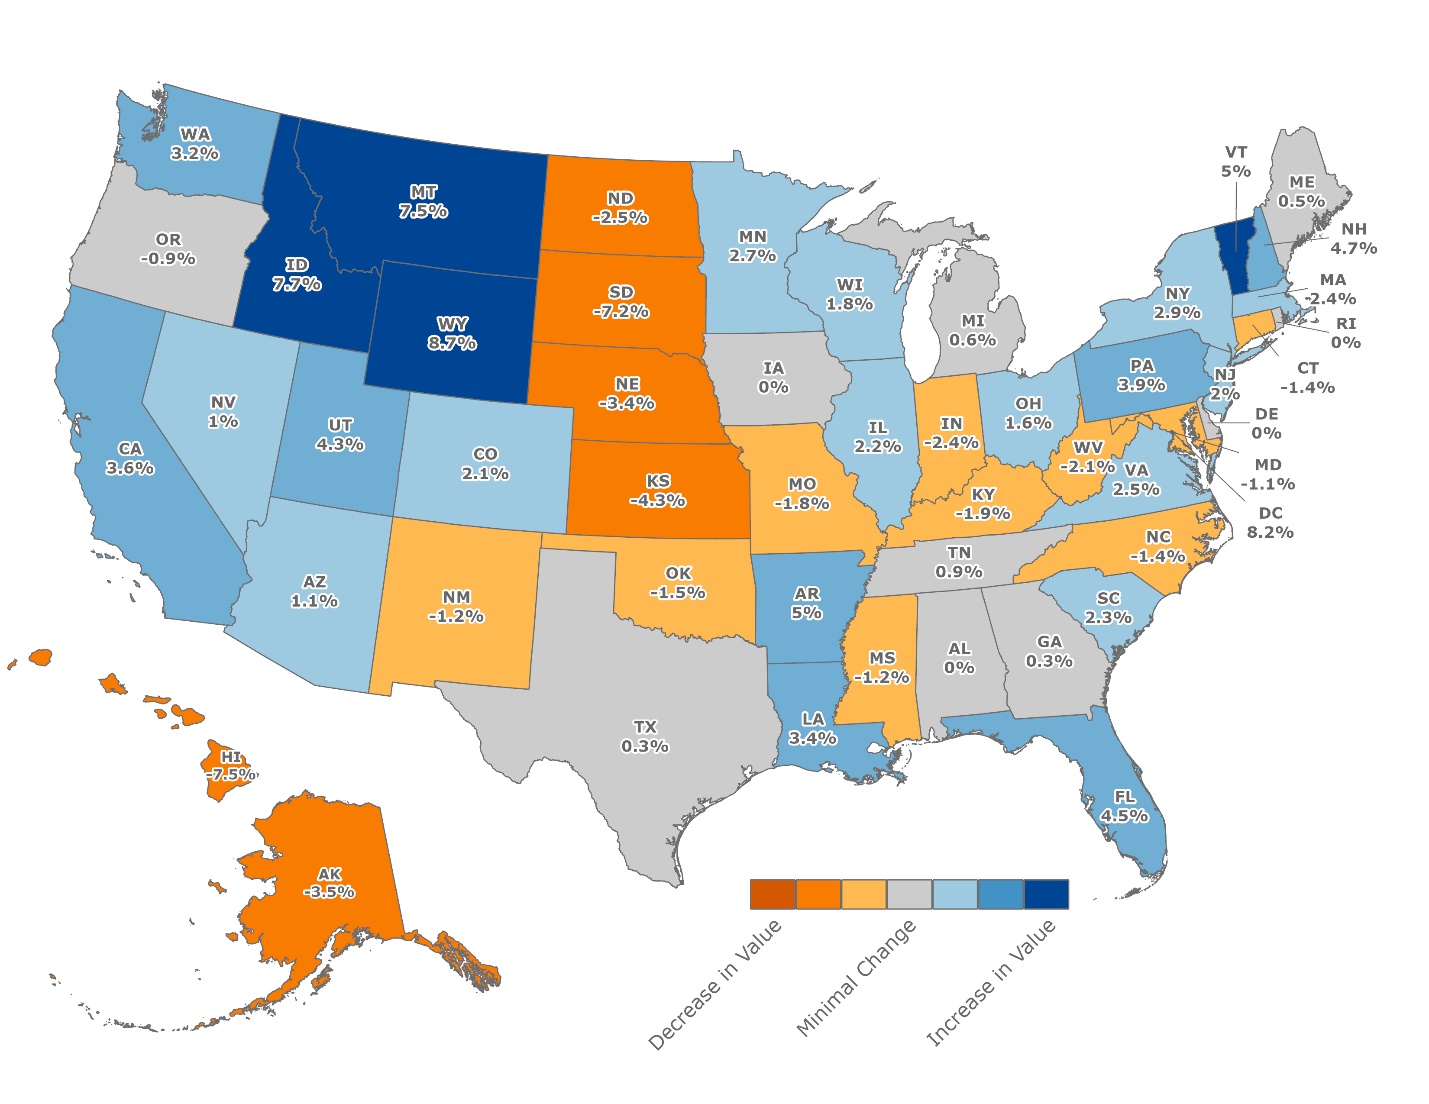
Figure 4 depicts the quarter-over-quarter percent change in median appraised value for single-family refinance appraisals for each state and the District of Columbia. Twenty-nine states and the District of Columbia experienced increases in median appraised value, with the greatest increases in Wyoming, the District of Columbia, Idaho, Montana, and Vermont. Four states experienced no change, while 17 states experienced declines in median appraised value, with the largest declines in Hawaii, South Dakota, Kansas, Alaska, and Nebraska.
Figure 4: Quarter-Over-Quarter Changes in Median Appraised Value for Single-Family Refinance Loans, 2024Q1-2024Q2

Source: FHFA. Uniform Appraisal Dataset Aggregate Statistics
Summary
The 2024Q2 UAD Aggregate Statistics show that the number of Enterprise single-family appraisals increased over both the last year and the last quarter. The single-family median appraised value for purchase and refinance appraisals rose over the last year and quarter. For Enterprise condominium appraisals, volume decreased for purchase appraisals over the previous year, but increased over the previous quarter, while volume increased over both the previous year and quarter for refinance appraisals. Meanwhile, median appraised value increased both for purchase and refinance Enterprise condominium appraisals over the previous year, while median appraised value decreased slightly for purchase Enterprise condominium appraisals over the previous quarter.
Regionally, the median appraised value for single-family purchase appraisals increased from last year, with the largest increases spread out in the Northeast, Midwest, and West. Similarly, the single-family median appraised value rose over the quarter for purchase appraisals, with the largest increases occurring mostly in the Northeast and Midwest. Year-over-year increases in median appraised value for refinance appraisals were spread throughout all regions of the United States. Eleven states experienced over 10 percent year-over-year increases. The quarter-over-quarter changes were more mixed, with declines more prevalent outside of the Northeast.
The trends reported in this blog could be further explored with the UAD Aggregate Statistics and other FHFA data. The UAD Aggregate Statistics continue to serve as a key resource to glean information on appraisals. For additional aggregate statistics at the national, state, county, census tract, and metropolitan area levels, see the UAD Aggregate Statistics Dashboard Portal. Trends in the Top 100 Metropolitan Statistical Areas are available in our interactive dashboard: https://www.fhfa.gov/data/dashboard/uad-aggregate-statistics-top-100-metro-areas-dashboard.
[1] FHFA derives UAD Aggregate Statistics from aggregating UAD appraisal records. The UAD is a standardized industry dataset for appraisal information that Fannie Mae and Freddie Mac receive electronically through the Uniform Collateral Data Portal© (UCDP©). The UAD Aggregate Statistics data universe is comprised of single-family properties appraised using Fannie Mae Form 1004/Freddie Mac Form 70 and condominiums appraised using Fannie Mae Form 1073/Freddie Mac Form 465. We exclude manufactured homes, small multifamily rental properties, and other non-standard appraisals. The universe includes properties appraised for the purposes of a sale or refinance. We exclude other types of appraisals, such as construction loan appraisals. We include appraisals for properties in the 50 U.S. states, the District of Columbia, and Puerto Rico, and exclude the U.S. Virgin Islands and Guam. For more information, please refer to the UAD Aggregate Statistics Data File Overview document.
[2] The average second quarter percent change in the number of appraisals was calculated by averaging the percent changes between the first and the second quarters each year from 2013 to 2024.
By: Rashida Dorsey-Johnson
Branch Chief, Statistical Products
Office of the Chief Data Officer
Division of Research and Statistics
By: Diego Saltes
Senior Survey Statistician, Statistical Products Branch
Office of the Chief Data Officer
Division of Research and Statistics
