Introduction
In this blog post, we share insights into the demographics and housing characteristics of rural America. Through our analysis of the Census Bureau’s American Community Survey (ACS), we find that, on average, rural areas are older, have lower labor force participation rates, and have lower incomes than non-rural areas. Generally, rural markets tend to be underserved, with certain high-needs rural regions and populations constituting areas of persistent poverty. Hence, as required by the Housing and Economic Recovery Act of 2008 (HERA), the Federal Housing Finance Agency (FHFA) issued a rule establishing a Duty to Serve (DTS) underserved markets, including rural areas, for Fannie Mae and Freddie Mac (the Enterprises).[1] Stakeholders and other interested members of the public may use FHFA’s Public Use Database (PUDB) to track the volume, proportion, and characteristics of the Enterprises’ loan acquisitions in rural areas over time—in the analysis we present here, we find that Enterprise acquisitions are increasingly composed of mortgages originated for rural first-time homebuyers.[2]
Rural American Demographics
With a population of 81.7 million people, 24.4 percent of the U.S. population lives in DTS-defined rural areas.[3] The rural population is widely distributed, as shown in Figure 1. Massachusetts is the most urbanized state, with only 4.1 percent of the population living in rural areas.[4] Vermont is the most rural state, with 80.9 percent of the population living in rural areas.
Figure 1. Share of Population Living in Rural Areas by State
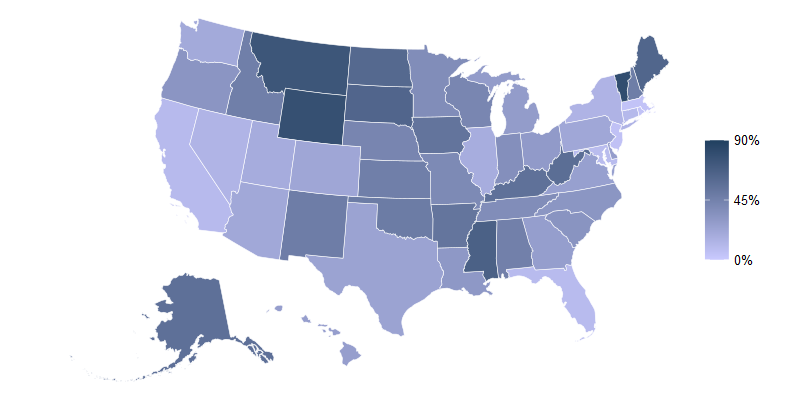
Source: FHFA analysis of 2018-2022 ACS data based on 2023 DTS rural designations
Seniors tend to represent a greater share of the population in rural areas. Approximately 19.2 percent of the rural population is aged 65 and older, compared to 15.7 percent in non-rural areas. It is likely that this gap could increase in coming years, as the share of persons between 55-64 is also relatively larger in rural areas (14.2 percent) than non-rural areas (12.4 percent). This may also pose economic challenges—a larger share of the population that is retirement-age implies a lower employment-population ratio.
Figure 2. U.S. Rural and Non-Rural Population by Age in 2022
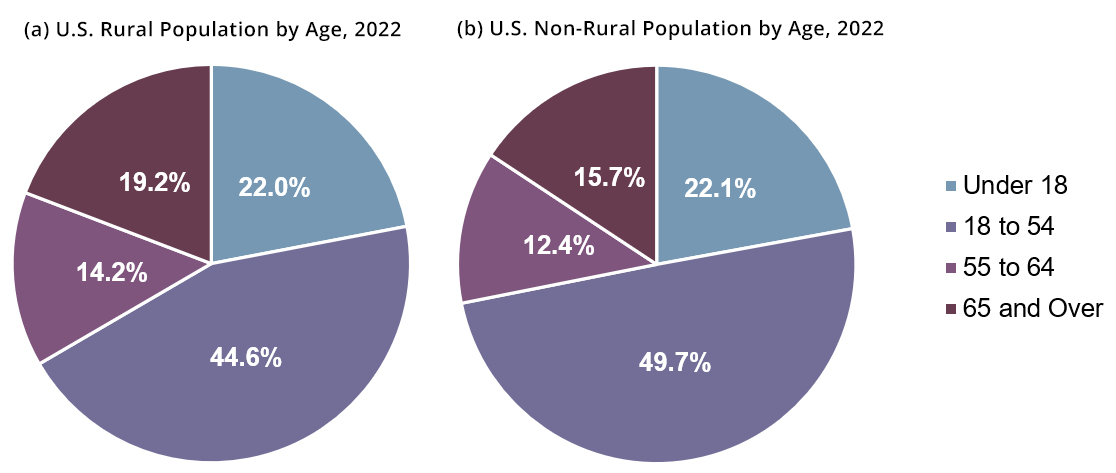
Source: FHFA analysis of 2018-2022 ACS data based on 2023 DTS rural designations. Sum of percentages may not be 100 percent due to rounding.
To some extent, these economic challenges already exist. The share of the population between 18 and 54, which economists generally consider to be the prime-age labor force, is 44.6 percent of the rural population. The corresponding share in the non-rural population is 49.7 percent. This is reflected in the 6.9 percentage points lower labor force participation rate in rural areas than non-rural areas.[5]
Considering differences in income distributions, rural incomes tend to be compressed relative to non-rural incomes, as shown in Figure 3. Median household income is lower in rural areas compared to non-rural areas. Furthermore, while 39.5 percent of households in rural areas have an income less than $50,000, 32.5 percent of households in non-rural areas have an income less than $50,000. Likewise, higher income households are concentrated in non-rural areas.
Figure 3. Income Distribution of Households in Rural and Non-Rural Areas
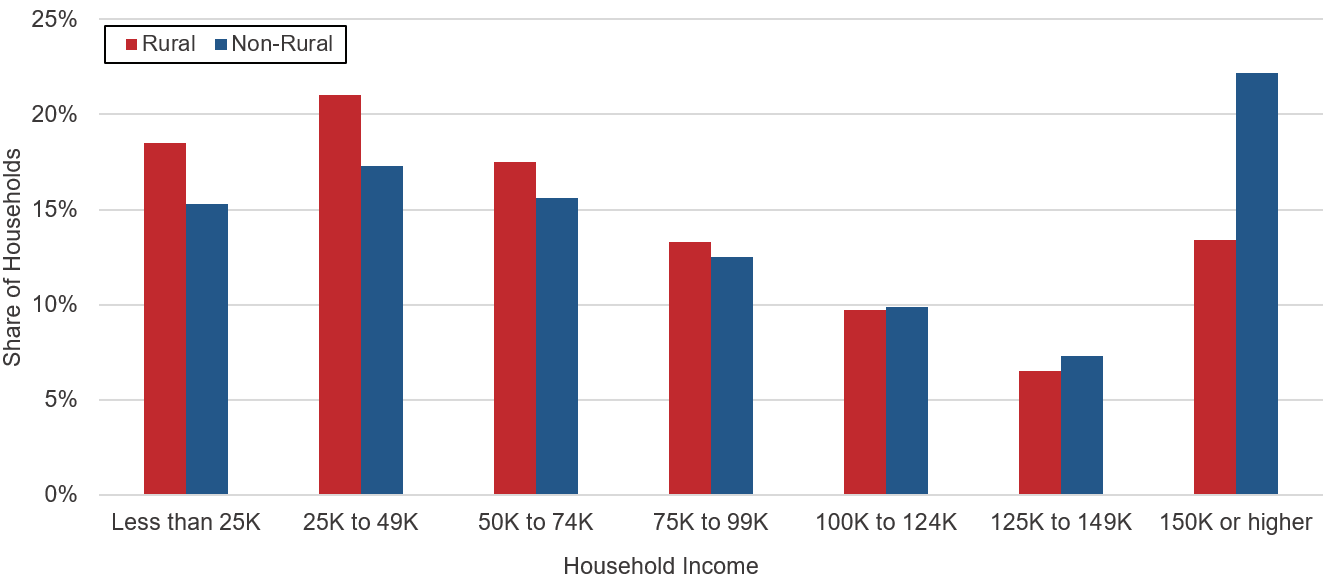
Source: FHFA analysis of 2018-2022 ACS data based on 2023 DTS rural designations.
Enterprises’ Acquisitions in Rural Areas
Consistent with the Duty to Serve rule, which requires the Enterprises to develop and implement plans that address the housing needs among low-income individuals in several underserved markets, Fannie Mae and Freddie Mac are providing targeted efforts to enhance access to mortgage financing in rural areas. Using FHFA’s PUDB, we find that the share of the Enterprises’ single-family (SF) purchase-money mortgage (PMM) acquisitions in rural areas in 2023 was 21.3 percent, up from 16.9 percent in 2019, as shown in Figure 4.[6] We further identify that the share of first-time homebuyers (FTHB) has been rising as a proportion of the Enterprises’ acquisitions since 2019 in both rural and non-rural areas. While first-time homebuyer loans are a relatively larger share of non-rural acquisitions compared to rural acquisitions, this is consistent with the younger non-rural age distribution presented in Figure 2. For all additional results in this section, for simplicity, we use acquisitions to refer to Enterprise SF PMM acquisitions.
Figure 4. Share of Enterprises’ Acquisitions in Rural Areas from 2019 to 2023
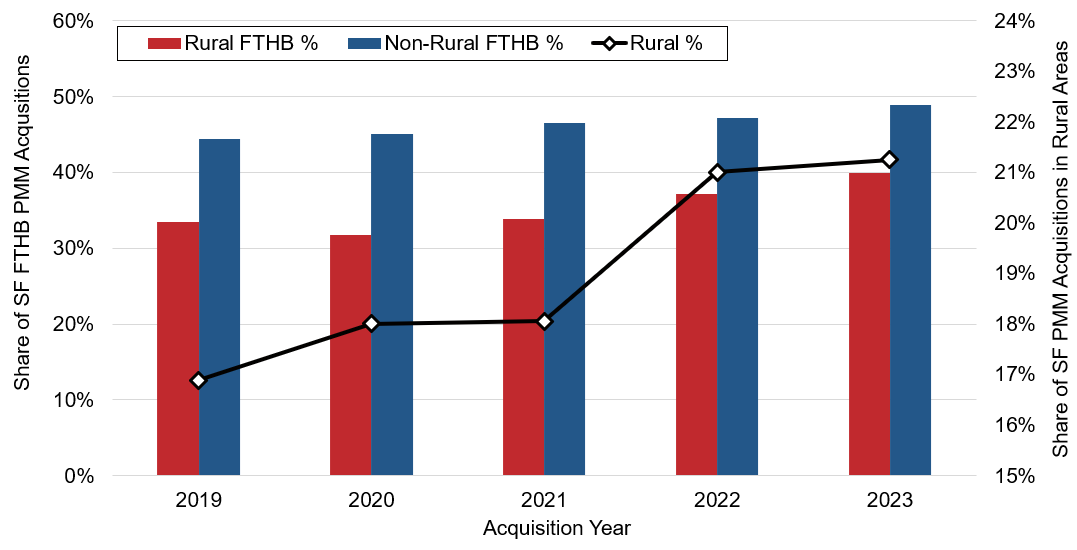
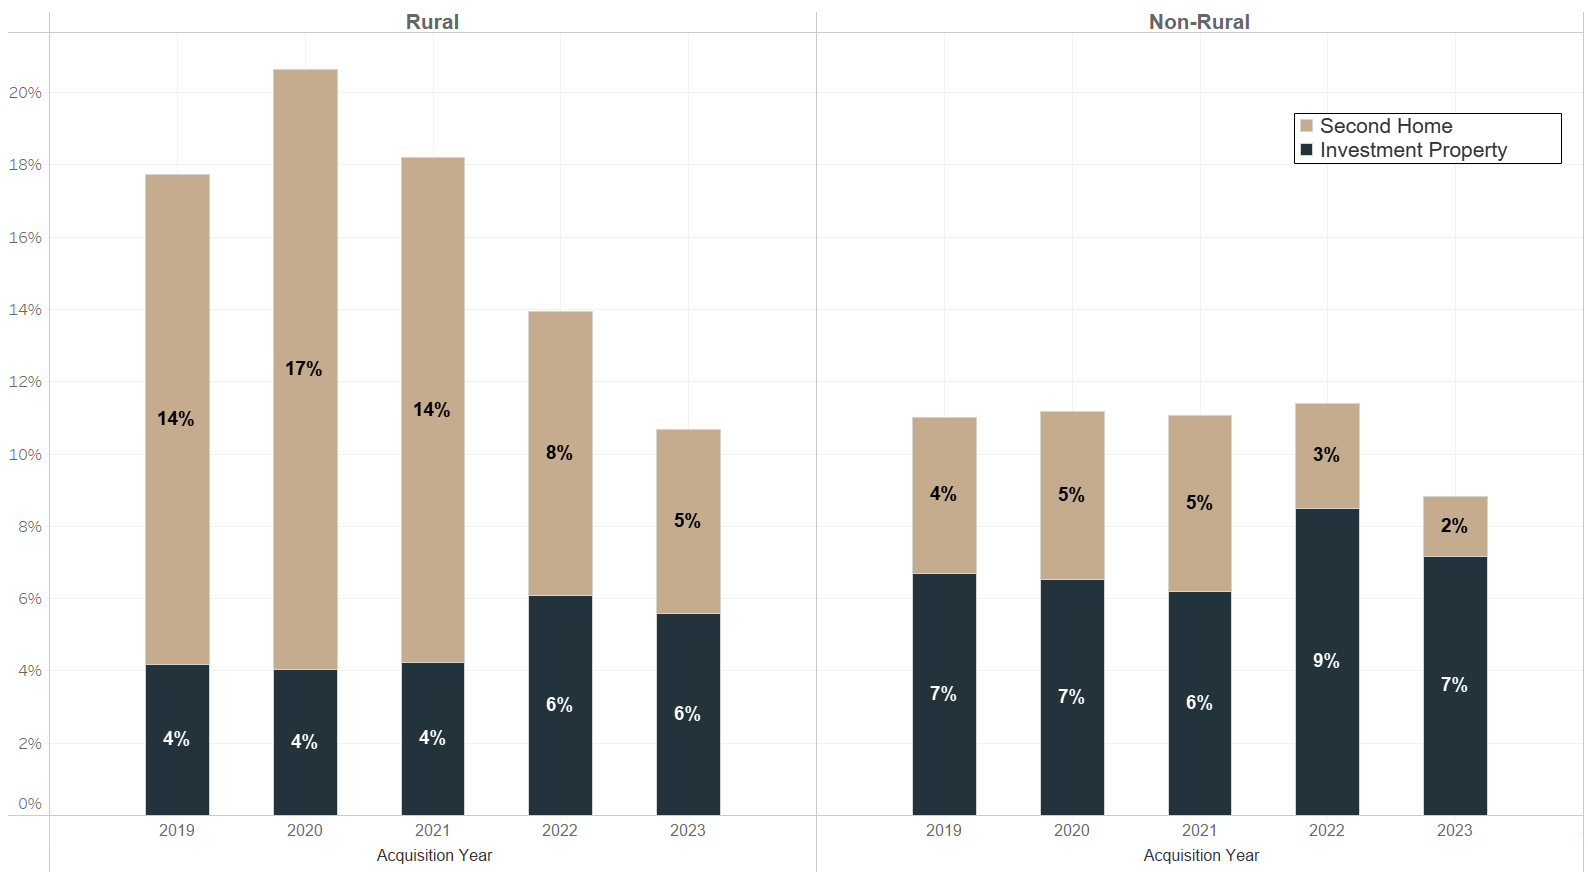
A lower share of first-time homebuyers in rural areas may also be a consequence of different occupancy types. To study this, we present Figure 5, which uses the PUDB to track acquisitions of second home and investment property mortgages. We find a declining trend over the last four years in rural areas for acquisitions of these occupancy categories. Meanwhile, in non-rural areas, the share of second homes and investment properties follows no clearly discernible trend. As a share of the Enterprises’ acquisitions, mortgages for homes intended as primary residences in rural areas are increasing.
Figure 5. Share of Acquisitions by Occupancy Type
A study of borrower demographics as detailed in the PUDB is also illustrative. In Figure 6, we find that borrowers under the age of 35 are an increasing share of acquisitions both in rural (34 percent) and non-rural (38 percent) areas relative to 2019. Meanwhile, in Figure 7, median, inflation-adjusted borrower income associated with Enterprise rural acquisitions has followed no clear, discernible trend in the last five years—in fact, median household income associated with the Enterprises’ rural acquisitions was modestly lower in 2023 ($89,777) than in 2020 ($90,879).[7] Ultimately, conforming loans to younger, middle-income borrowers are a growing component of the Enterprises’ purchases in rural areas.
Figure 6. Share of Acquisitions by Borrower Age
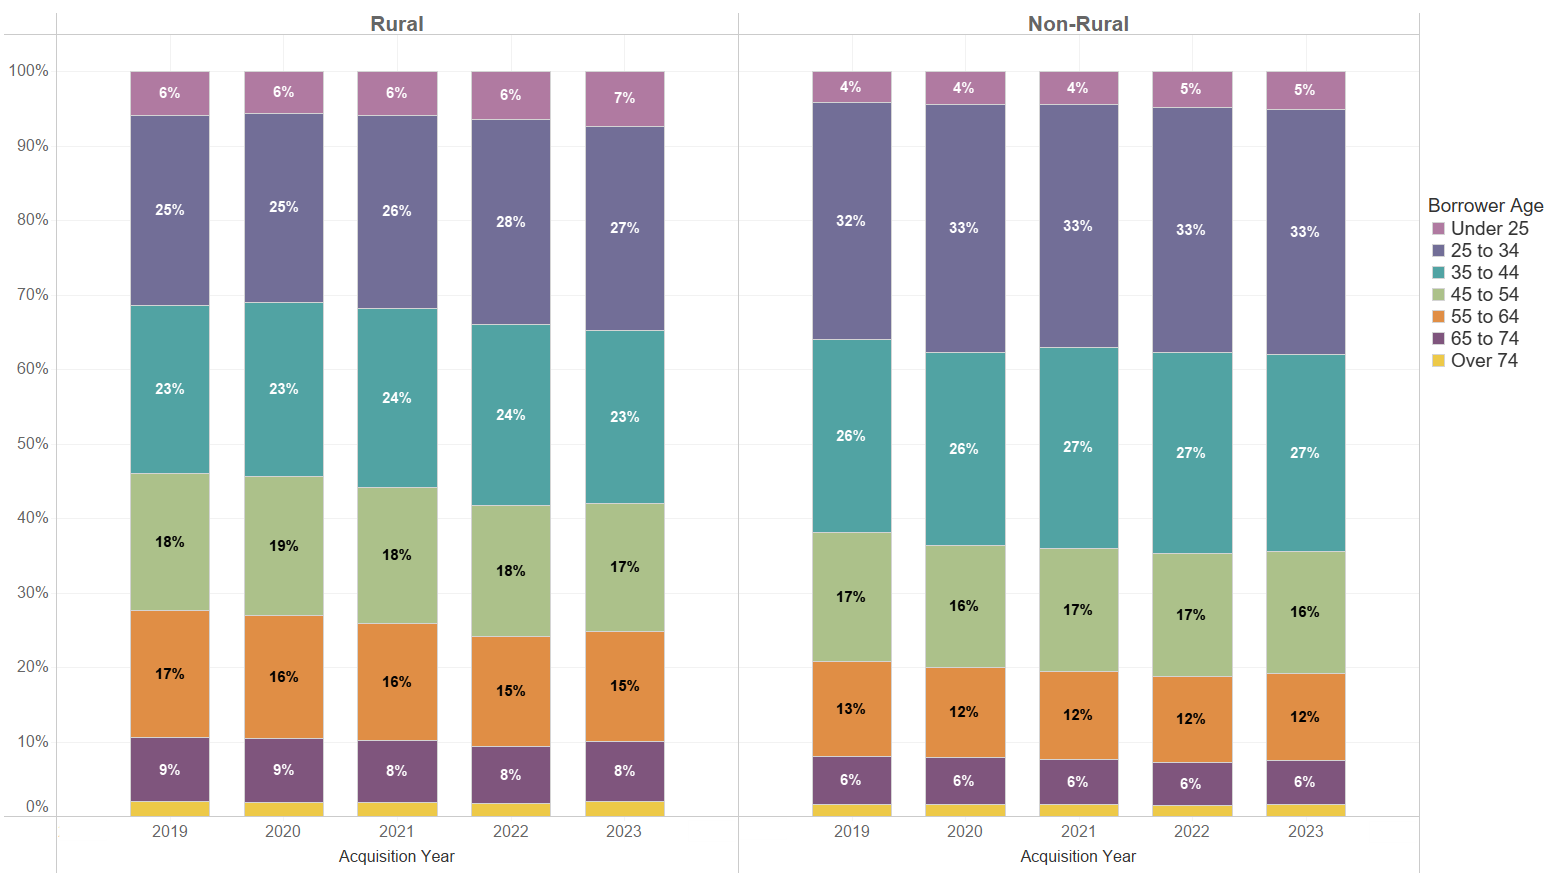
Figure 7. Median Borrower Income (in 2019 dollars)
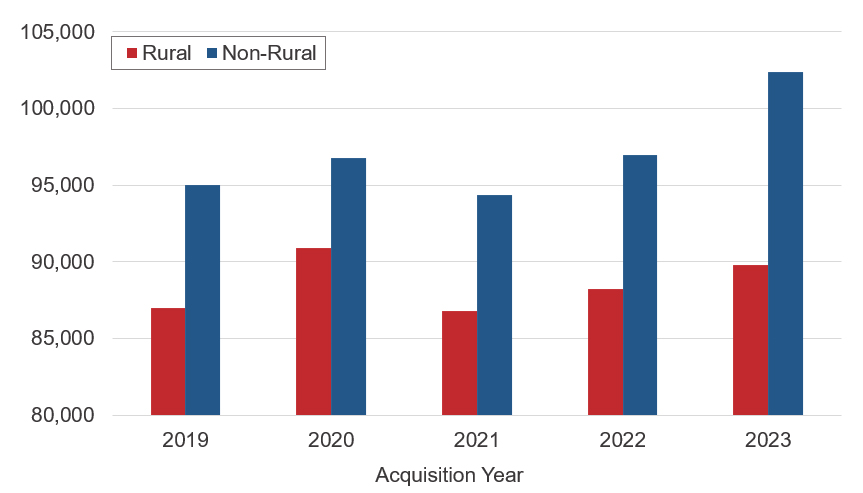
Source: FHFA Analysis of 2019-2023 PUDB Data. Acquisitions include only single-family purchase-money mortgages.
Conclusion
Our analysis shares insights into the demographics of rural America and its challenges related to housing finance. Rural areas, on average, have a higher share of seniors in the population, a lower labor force participation rate, and lower household incomes than non-rural areas. Opportunities exist to expand access to mortgage financing in a safe and sound manner; FHFA, through its Duty to Serve Program, will work with the Enterprises toward this objective. The PUDB is a valuable source through which stakeholders may track the volume, proportion, and characteristics of the Enterprises’ acquisitions in rural areas over time.
[1] The Duty to Serve Final Rule defines a “rural area” as: (i) a census tract outside of a metropolitan statistical area (MSA) as designated by the Office of Management and Budget (OMB); or (ii) a census tract in an MSA as designated by OMB that is (A) Outside of the MSA’s Urbanized Areas as designated by the U.S. Department of Agriculture’s (USDA) Rural-Urban Commuting Area (RUCA) Code #1, and outside of tracts with a housing density of more than 64 housing units per square mile in USDA’s RUCA Code #2; or (B) A colonia census tract that does not satisfy paragraphs (i) or (ii)(A) of this definition (effective July 1, 2023). This DTS-specific definition of rural areas, which comes from 12 C.F.R. 1282.1, may lead to statistics which do not align with those reported by other sources. More information is available at https://www.fhfa.gov/programs/duty-to-serve.
[2] The Public Use Database (PUDB) is released annually to meet FHFA’s requirement under 12 U.S.C. 4543 and 4546(d) to publicly disclose data about the Enterprises’ single-family and multifamily mortgage acquisitions, and is available at https://www.fhfa.gov/data/public-use-database-fannie-mae-and-freddie-mac.
[3] FHFA analysis of 2018-2022 ACS data based on 2023 DTS rural designations.
[4] Exclusive of the District of Columbia, which contains no DTS defined rural areas.
[5] FHFA analysis of 2018-2022 ACS data based on 2023 DTS rural designations.
[6] One important caveat regarding this trend is that the increase in the share of acquired rural loans, beginning in 2022, is largely a consequence of FHFA and the Enterprises defining new rural areas based on 2020 census tracts. FHFA used a crosswalk between 2010 and 2020 census tracts that is responsible for an increase in rural tracts. More information is in FHFA’s 2022 Housing Mission Report: https://www.fhfa.gov/sites/default/files/2024-02/FHFA-2022-Mission-Report.pdf.
[7] We rebased incomes to 2019 levels using the CPI from the Bureau of Labor Statistics. Access these data at https://www.bls.gov/cpi/tables/.
By: Sanjay Ramakrishnan
Economist
Division of Research and Statistics
Matthew Suandi
Senior Economist
Division of Research and Statistics
Tagged: FHFA Stats Blog; Rural; Demographics