Large increases in the FHFA Conforming Loan Limit values in recent years have raised concerns that those changes may be permitting Enterprise loan acquisitions to drift into higher-priced segments of the housing market. We find that Enterprise-acquired loans close to the limit have not shifted toward supporting relatively higher-end homes within local markets.
Introduction
Each November, the Federal Housing Finance Agency (FHFA) releases updates to the FHFA Conforming Loan Limit values (CLL), specifying the highest loan amounts for single-family mortgages that Fannie Mae and Freddie Mac (the Enterprises) can purchase in the coming year. These loan limits are set according to formulas established by Congress in the Housing and Economic Recovery Act of 2008 (HERA).[1]
In recent years, some stakeholders have raised concerns that the CLL may now be too high.[2] However, our analysis finds that increases in the CLL are not leading to Enterprise support for increasingly higher-end homes. Specifically, when we look at the relative price position of homes purchased with loans near the CLL, we find that it has held stable over time.
Concerns about the Increasing CLL
After remaining unchanged at $417,000 for eight years following the 2008 Financial Crisis, as house prices recovered from the crash and then continued to increase, the national baseline CLL started to rise in 2017. It has risen noticeably since then, as shown in Figure 1:[3]
Figure 1. National Baseline Conforming Loan Limits
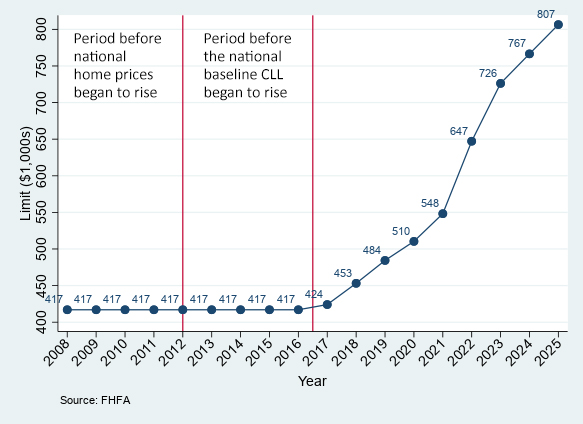
Though CLL increases have been more moderate for the last two years, the steep rise in 2022 and 2023 led to concerns that the CLL might have climbed too high. This concern has been amplified by the “sticker shock” of local limits exceeding $1 million in certain high-cost areas, where the CLL is set above the national baseline.[4] In this environment, it is reasonable to ask if these limits are now supporting larger or more extravagant homes compared to when HERA was first enacted.
The answer, perhaps surprisingly, is no. While it is true that a loan at today’s national baseline CLL can be used to purchase a relatively high-end home in most parts of the country, that has been true since HERA was enacted in 2008.
Our key finding is that the relative position of homes purchased with loans near the CLL (within the house price distribution for a given locality) has held relatively stable across the country, and has declined in many areas. In other words, a borrower in 2023[5] receiving a loan at the CLL of $726,200 would, in general, be able to afford a similar home as they might have in the same city with a $417,000 loan in 2012 or 2013.[6]
Positioning the CLL within the Local House-Price Distribution
The CLL governs loan amounts for Enterprise acquisitions, not house prices. Depending on a borrower’s downpayment, a $450,000 loan could support a home purchase price of $500,000, $600,000, $1,000,000, or more. To study trends over time in the effects of increases to the CLL on the distribution of house prices supported by Enterprise loan acquisitions, we must cross-reference the CLL to corresponding house prices. For that, we adopt the following procedure:
First, we select all Enterprise home-purchase loans with an acquisition balance at or close to the applicable CLL (either the national baseline or a higher local limit),[7] defining “close” as within 5 percent.[8] For each of these near-CLL loans, we identify the corresponding home purchase price.
Second, we identify the county for each loan and property to assign them to housing markets. Each of the top 100 Metropolitan Statistical Areas (MSAs), by number of home sales, defines a single market.[9] We then consolidate all counties outside those MSAs into state-level “markets,” defining a set of state-based small- and non-metro markets.
Third, we construct home price distributions using the CoreLogic Owner Transfer dataset, which provides comprehensive [10] coverage of property sales throughout the country.[11] For each market and year, we rank order single-family home sales by price, then define percentiles from 1–100.
Finally, using these market percentiles, we match each near-CLL-loan home to its position in the relevant market. Home prices above the 99th percentile are assigned a value of 99, between the 98th and 99th percentiles are assigned a 98, and so on.
Results: Position of the CLL Over Time
Figure 2 shows averages over time of house-price percentiles for near-CLL loans:
Figure 2. Average House-Price Percentiles of Near-CLL Loans
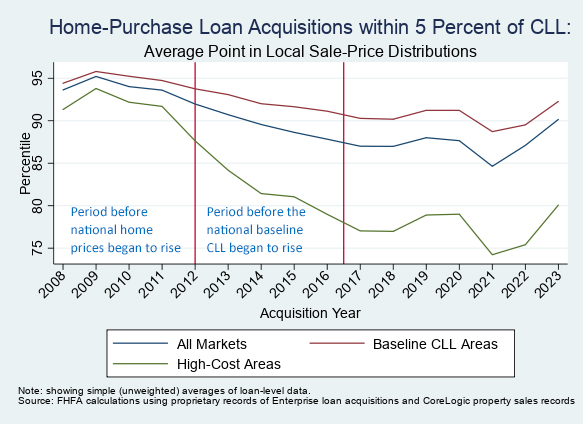
The key takeaway from Figure 2 is that, rather than drifting upward, the average position of CLL-supported homes relative to local house prices generally drifted downward from 2009 to 2016, and has remained largely stable since then as the baseline CLL began to rise.
This decline is particularly pronounced in high-cost areas. That is partly due to a higher CLL set for high-cost areas in 2008–2011 under the Economic Stimulus Act of 2008 and its extensions for 2009–2011.[12] However, the decline continued from 2012 through 2017.
Areas subject to the national baseline CLL have seen a less pronounced decline in the average house-price percentile of near-CLL loans. In 2008–2011, loans at the national baseline CLL of $417,000 matched to a purchase price around the 95th percentile, on average. This average declined steadily down to the 90th percentile by 2017.
Since the national baseline CLL began to rise in 2017, the position of CLL-supported home prices has been largely stable, and well below where it was in 2008–2012. The CLL has supported home purchases centered around the 90th percentile in baseline CLL areas, and centered below the 80th percentile in high-cost areas. The national average percentile was a bit higher in 2023 at 90, up from 88 in 2016. However, there is no clear upward trend: from 2017 to 2022, the average home-price percentile was below its 2016 level in all but one year.
Of course, averages rarely tell the full story. We might reasonably be concerned that by averaging house-price percentiles across all loans in baseline CLL and high-cost areas, we could mask meaningful changes in the position of homes supported by near-CLL loans.
To address this concern, we look at the full distribution of home prices for near-CLL loans (Figure 3). This allows us to consider questions like, “What fraction of near-CLL loans supported purchases above the 90th (or 95th) percentile in their local house-price distribution in each year?”
Figure 3. Distribution of Near-CLL Home Prices
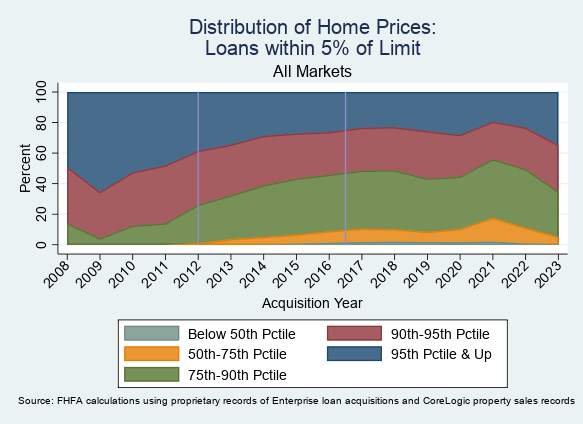
Figure 3 shows that the positions of near-CLL loans in their local house-price distributions have been largely stable over time. One of the biggest changes has been in the share of near-CLL-loan homes at or above the 95th percentile within their local-market house prices. That share fell steadily from 2009 to 2016, and has been mostly stable since then, with a slight uptick in 2023. CLL-supported homes have then, overall, moved away from the highest end of local markets. Concurrently, the share between the 75th and 90th percentiles increased from 2009 to 2016, and has been mostly stable since then. The share of near-CLL loans with house prices between the 90th and 95th percentiles has been quite stable throughout the entire post-HERA period.
Figure 4 helps illuminate differences between baseline-CLL areas and high-cost CLL areas.[13] While a large share of near-CLL-loan home prices have been above the 95th percentile in baseline areas, that share has been quite small in high-cost areas, particularly starting in 2012.
High-cost areas saw a substantial share of near-CLL-loan homes in the 50th to 75th percentile range (between 20 and 40% since 2014), compared to a very small share (peaking at 7% in 2021) in baseline-CLL areas. High-cost areas also had a measurable share of homes below the 50th percentile in price from 2016 to 2021, but that largely disappeared by 2023.
Figure 4. Distribution in Baseline CLL vs. High-Cost Areas
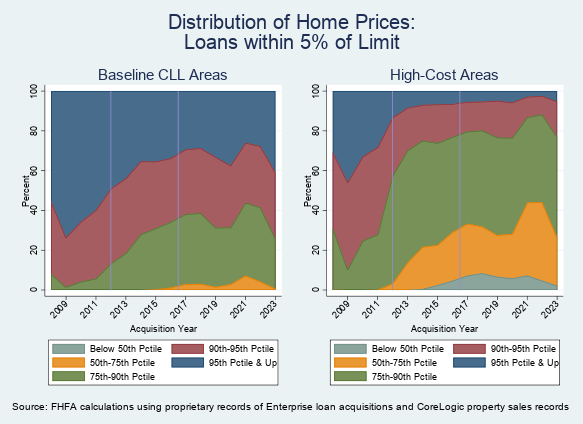
The share of near-CLL-loan supported homes in high-cost areas below the 90th percentile has exceeded 60 percent since 2013 and has consistently exceeded the share in baseline CLL areas below the 95th percentile. The share of near-CLL loans in baseline CLL areas in the 90th to 95th house-price percentile range has been stable over the entire post-HERA period.
Conclusion
HERA requires that FHFA match annual changes in the national baseline CLL to a national house price index, to establish a consistent relationship over time.
To address concerns that CLL has climbed too high in recent years, we analyze home prices supported by those limits. While it is true that, outside of high-cost areas, loans near the CLL often support home purchases at the high end of their local markets, this has been the case since HERA was passed in 2008.
We find that CLL-supported home purchases have largely kept pace with local housing markets. While there was an uptick in the position of CLL-supported home purchases in 2023, there has been no systematic upward trend in recent years. Overall, we find no evidence that growth in CLL over time has led to increased Enterprise support for the highest-priced homes.
[1] FHFA adjusts the baseline CLL each year following rules set forth in HERA to reflect changes in the national average home price. HERA specifies that the Agency “establish and maintain” an index for tracking average home prices for this purpose. Increases to the CLL follow the FHFA Expanded Data House Price Index. For more information on how the CLL is constructed, see: FHFA's Conforming Loan Limit webpage.
[2] See, for example, this statement from the Housing Policy Council.
[3] Though national house prices began to rise in 2012, they remained below their pre-recession peak for several years. HERA codified that the national baseline CLL should not decrease following house price downturns, but also provided that as house prices begin to recover, the CLL should only start to rise once house prices exceed their earlier peak.
[4] Specifically, HERA sets high-cost area CLLs to 115 percent of the area median home price, up to a cap of 150 percent of the national baseline CLL. Loans originated between July 2007 and September 2011 were subject to a different formula, determined by the Economic Stimulus Act of 2008 and later extensions, which provided for even higher CLLs in high-cost areas. That formula set high-cost area loan limits at 125 percent of area median home price, up to a cap of 175 percent of the baseline CLL.
[5] Our analysis ends in 2023, the last year for which we have complete data on home purchases.
[6] This is despite the fact that, based on CPI Inflation, $417,000 in 2012 would be equivalent to only around $550,000 in 2023 (well below $726,000). House price appreciation has significantly outpaced overall inflation for this period.
[7] That is, the county-level CLL for the given acquisition year. We restrict our analysis to one-unit properties in the contiguous US (48 states + DC). We exclude AK, HI, and territories, in part because in several of these areas a different set of rules govern how the CLL is set.
[8] Using “within 5 percent” as our determination for “near” the CLL represents a subjective threshold, but we did not want to restrict attention only to the limited set of loans precisely at the CLL.
[9] The top MSAs are determined based on average yearly home sale count in the CoreLogic data (see below) from 2008–2023.
[10] Coverage of sales prices is less complete for properties in “Non-Disclosure” states and jurisdictions, which could potentially skew our estimates of the price distribution in these places. Even in Non-Disclosure states, however, there is an ample volume of transactions with sales prices reported, sufficient for an estimate of the house price distribution in local markets as defined here.
[11] We restrict sales to arms-length transactions of single-family residential properties or condos with no more than one building on the property.
[12] See earlier note.
[13] Note that an area is classified as high-cost if the high-cost CLL formula yields a number larger than the national baseline. Thus, the set of areas considered high-cost is not stable over this time period; many areas previously deemed high-cost now have a CLL set to the national baseline.
By: Scott Weiner
Economist
Division of Research and Statistics