Housing production has been on a downward trend for many decades. In the wake of the 2008 financial crisis, housing starts fell to their lowest level since at least the 1960s, on a per capita basis. Since then, housing production has recovered somewhat, but still remains below the level of previous peaks in 2006 and 1998, which were in turn below housing cycle peaks in the 1970s and 1980s. [1]
One reason for this production shortfall has been the spread of strict land use controls, including minimum lot sizes and zoning that permits only single-family housing to be built, as well as the proliferation of time-consuming regulatory requirements for multiple layers of review and approvals. More recently, some states and localities have been rolling back these restrictions, allowing duplexes and other multi-family housing to be built “as of right” on lots that previously were restricted to single-family homes. Notably, these states include California and Oregon, which historically have had some of the nation’s strictest land use controls.
The Enterprises are mainly what economists would term “demand-side” actors; that is, by supporting access to credit for borrowers, they influence the ability of households to pay for housing. By affecting demand for housing, Enterprise activity may help induce new housing construction or renovation. They can also play a more direct role in housing supply, for example, by acquiring loans funding newly built homes. This research note examines the variation in the Enterprise market share across cities to explore patterns in the types of cities where Enterprise credit is most available.
Land use controls can be complex and hard to measure. These regulations are typically set at the local level by thousands of different governments. One recent study surveyed 10,949 local governments about their land use regulations, receiving 2,825 responses. [2] In addition, the impact of regulations cannot necessarily be determined merely by reading their text in isolation. Allowing triplexes on what used to be single-family lots in Minneapolis has yet to result in more than a handful of new units being built, perhaps because height, setback, and other requirements stayed the same. [3] There are also many informal or hard-to-measure characteristics of particular areas’ permitting actions. Thus, this research report will focus on final outcome measures: the relation between home price and housing stock growth, similar to other current analyses. [4] Relative changes in these two variables reflect the local supply-side milieu, including restrictive land use policies, but also other demand and supply factors.
Univariate Analysis of Enterprise Market Share
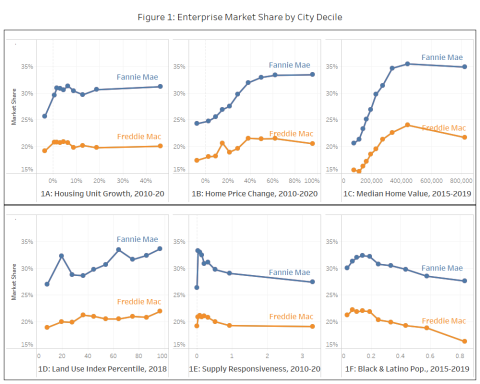
In the cities with populations of 10,000 or more examined here, Fannie Mae’s share is 29% while Freddie Mac’s is 20%. Ginnie Mae, which securitizes FHA and VA loans had a 14% share, while lenders retained 16% of mortgages for their own portfolio. The remaining 21% was sold to “other” financial institutions such as banks and insurance companies, or privately securitized. Figures 1A-1F show how the Fannie Mae and Freddie Mac share of the local mortgage market vary with key housing market factors. [5]

Figure 1A categorizes cities into 10 deciles based on the growth in housing units over the 2010s. Freddie Mac’s market share is fairly similar across deciles. Fannie Mae’s share is fairly constant in all deciles but the first. In cities with low lowest housing unit growth (or largest declines), Fannie Mae’s share is about five percentage points lower than in cities with higher growth.
Figure 1B categorizes cities by deciles of home price change. Here, both Enterprises market shares rise with price growth. Fannie Mae’s market share in the cities with the lowest price growth (or largest declines) is about 9 percentage points less than its peak share, and Freddie Mac’s share is about 4 percentage points less than its peak.
Figure 1C classifies cities by median home values, showing an especially sharp increase. Fannie Mae’s market share in cities with the lowest home values is fully 15 percentage points below the peak, while for Freddie Mac’s the difference is 8 percentage points. While it would be expected for the Enterprise share to drop off or fall in the highest deciles, due to the conforming loan limit which caps the size of the mortgages the Enterprises can offer, there are no explicit policies that limit small value loans.
Figure 1D shows cities by percentiles of the Wharton Residential Land Use Regulatory Index. [6] The index has been shown to predict land and house values, although it is just is one among many possible measures of regulation. The Enterprise share is highest where regulation is strictest. Fannie’s share is 7 percentage points higher in the tenth decile compared to the first, while Freddie Mac’s is 3 percentage points higher.
Figure 1E categorizes cities by supply responsiveness, as measured by the ratio of the percentage change in the housing stock to the percentage change in home prices. [7] Enterprise shares are highest where supply is least responsive.
Figure 1F categorizes cities by the proportion of their population that is Black or Latino. The Enterprise market share decreases as the Black and Latino population increases. Fannie Mae’s share is 3 percentage points lower in the highest decile compared to the lowest, while Freddie Mac’s share is 5 percentage points lower.
Summarizing, the Enterprise share is lowest in cities with low and falling home prices, permissive land use regulation, and high Black and Latino population shares. While the aim of this report is not to explain these patterns, it is worth listing some possibilities.
Factors Affecting Enterprise ShareAfter a loan is originated, it is often (but not always) sold on the secondary market and securitized. The eventual owner of the mortgage is affected by the policies and practices of the Enterprises and their competitors such as FHA, by borrowers through their product choice, and by other entities such as originators and private mortgage insurance firms. There are a number of factors that influence the final destination of a loan in the secondary market. These may include (but are not limited to):
|
City Types
We group cities into four categories.
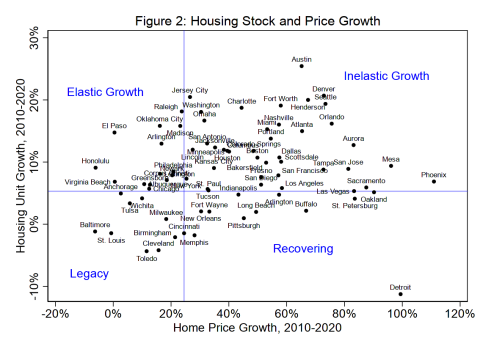
- Legacy Cities such as Baltimore, Milwaukee, and Cleveland experienced slow growth in both home prices and housing stock from 2010 to 2020. Growth in these cities was constrained by a lack of demand, so zoning and land use was likely not much of a factor.
- Recovering Cities such as Indianapolis, Detroit, and Memphis experienced high growth in home prices but added little new housing stock during the 2010s. Many of these cities had previously experienced population declines. When demand increased in the 2010s, it was reflected in higher housing prices, which probably induced greater investment in maintenance and rehabilitation, but prices remained too low to justify new construction. In Detroit, for example, house prices almost doubled in real terms, but typical house prices were still only $47,500 according to Zillow’s index.
- Inelastic Growth Cities such as New York, Los Angeles, and Houston experienced both home prices and housing stock growth. Increasing home prices are an indication that something was constraining housing supply, although we don’t know if it was land use policies or physical constraints such a lack of buildable land.
- Elastic Growth Cities such as Chicago, Philadelphia, and Oklahoma City saw housing stock growth with little corresponding price growth. This pattern suggests that there were relatively few land use restrictions or other barriers to expanding the housing stock.

View Source Data underlying Figure 2
Figure 2 plots the largest cities by home price and housing stock growth. El Paso, Oklahoma City, and Arlington, Virginia stand out in the upper left as having especially high housing growth with limited price growth; Baltimore and St. Louis as having especially low growth in both; Detroit as having high price growth despite a falling housing stock; while Austin, Denver, and Seattle having high levels of both measures.
Quadrants of home price and housing stock growth

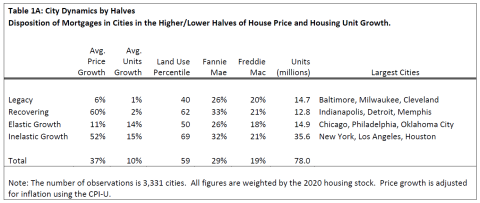
Table 1A shows the Enterprise market share in the four types of cities. The lines dividing the quadrants are drawn at the medians of housing stock and price growth, which implies that equal numbers of cities are on each side of the two lines, but not equal numbers of cities in each quadrant. The Inelastic Growth quadrant includes by far the most housing stock, 36 million units while the other three quadrants are similarly sized, each with 13 to 15 million housing units.
Notably, the classification generally lines up with the Wharton land use index. The Inelastic Growth Cities have the most restrictive land use polices (69th percentile) while the Elastic Growth Cities are considerably more permissive (50th percentile). The Legacy Cities have the loosest land use policies (40th percentile), consistent with the interpretation that these cities are demand constrained and therefor have little need for strict land use controls and little leverage to impose restrictions on developers. Finally, the Recovering Cities are at the 62nd percentile, suggesting that supply overhang is not the only factor holding back growth in some of these cities.
The Enterprise share of the mortgage market is higher in the types of cities with higher price growth. In both the low price growth quadrants (Legacy and Elastic Growth Cities), Fannie Mae’s market share is 26%. In the high price growth quadrants their share is 6 and 7 percentage points higher. Similarly, Freddie Mac’s share is 1 to 3 percentage points higher in the high price growth quadrants compared to the low price growth quadrants. Both Enterprises have the lowest market share in the Elastic Growth Cities.

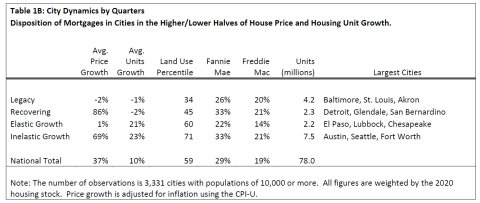
Table 1B shows the same figures dividing cities equally among quarters rather than halves. Thus, cities are split into 16 groups, and the table shows cities in the outermost 4 corners of the chart, which contain 21% of the housing stock included in this analysis. The Elastic Growth Cities contain the most housing stock, 7.5 million units, while the Legacy Cities contain about 4 million units, and the other two groups each have about 2 million units.
Again, the low price growth cities have smaller Enterprise shares while the high price growth cities have larger shares. The difference is especially large between the Elastic and Inelastic Growth Cities. The Enterprise share is smallest in the Elastic Growth Cities, at 22% for Fannie Mae and 14% for Freddie Mac, while Enterprise lending is 12 and 7 percentage points higher in the Inelastic Growth Cities for Fannie Mae and Freddie Mac, respectively.
Concluding remarks
Policies to increase the availability and affordability of housing continue to be a topic of major importance in the U.S. housing market. Especially with the rapid house price appreciation of the COVID-19 era, it is crucial to discern the underlying causes and assess the roles of various actors on both the demand and supply of housing. Research is needed on the extent to which Enterprise lending supports new housing supply in both direct and indirect ways, and on causal relationships. It will be challenging to assess the role of different supply restrictions, when and where they are binding, their distributional and affordability impacts, and how they came about in the first place. That said, these basic facts regarding Enterprise market shares may shed some light on key demand-side actors, and prompt future work on the subject.
FHFA is committed to more research on this important topic. On Oct. 26, 2021, FHFA conducted a virtual economic summit on housing supply and implications for affordable housing, with over 100 policymakers and researchers in attendance, featuring academic and practitioner presentations. FHFA is also planning to release further blog posts on this and related topics.
[1] Bernstein, Jared, Jeffery Zhang, Ryan Cummings, and Matthew Maury, “Alleviating Supply Constraints in the Housing Market," White House Council of Economic Advisors, September 1, 2021, https://bidenwhitehouse.archives.gov/cea/written-materials/2021/09/01/alleviating-supply-constraints-in-the-housing-market/
[2] Gyourko, Joseph, Jonathan S. Hartley, and Jacob Krimmel. "The local residential land use regulatory environment across US housing markets: Evidence from a new Wharton index." Journal of Urban Economics 124 (2021): 103337.
[3] In the first year since the adoption of the policy, only four triplexes were built, out of 3,300 newly constructed units. See Halter, Nick, “ Minneapolis move to legalize triplexes shows little impact," Axios Twin Cities, March 1, 2021, https://www.axios.com/local/twin-cities/2021/03/01/minneapolis-triplex-legalize-impact-little. See also Hamilton, Emily, “Want More Housing? Ending Single-Family Zoning Won't Do It," Bloomberg CityLab, July 29, 2020. https://www.bloomberg.com/news/articles/2020-07-29/to-add-housing-zoning-code-reform-is-just-a-start
[4] Schuetz, Jennifer (2021) “The housing challenges Virginia's next governor will have to face", https://www.brookings.edu/research/the-housing-challenges-virginias-next-governor-will-have-to-face/
[5] Market share is calculated from the Home Mortgage Disclosure Act data for the first three quarters of 2020. Loans originated in the fourth quarter are excluded because the purchaser of these loans is not reported if they are not sold by the end of the calendar year. Because many of the loans sold to “other" purchasers were later resold to the Enterprises, the Fannie Mae and Freddie Mac shares reported here are underestimates.
[6] This index is based on a survey of local governments about their land use policies, and is available for 892 of the 3,331 cities in the sample. It is standardized to have a mean of zero and a variance of one and we convert it to a percentile by assuming that the index is normally distributed. For a complete description, see Gyourko, Joseph, Jonathan Hartley, and Jacob Krimmel. The Local Residential Land Use Regulatory Environment Across US Housing Markets: Evidence from a New Wharton Index. No. w26573. National Bureau of Economic Research, 2019.
[7] This ratio can be thought of as a city-level housing supply elasticity if the elasticity is constant over time, and price is the only factor affecting housing supply. The responsiveness ratio is bottom-coded at zero in each city based on economic theory which suggests that supply elasticities must be positive. We assume that negative elasticities reflect factors such as non-market construction and shifting demand for particular types of housing, both of which may lead to new construction even with falling prices. Ratios are trimmed at the 1st and 99th percentiles due to their high variability, eliminating 68 cities from the sample. Without this data cleaning, the lowest decile responsiveness ratio would be about -4.6 and the second decile would be -0.05.
Data Sources
Secondary market share. Home Mortgage Disclosure Act Data, Agency File, Q1-Q3/2020.
Race, ethnicity, median home value, population. Census Bureau American Community Survey 2019 5-year file.
Housing unit growth. Decennial Census, 2010 and 2020.
Home price growth. Zillow Home Value Index, accessed September 24, 2021.
Land Use Regulation. Wharton Residential Land Use Regulation Index for 2018.
Inflation. Bureau of Labor Statistics, CPI-U.
Tagged: Land use; housing supply; zoning; Secondary Mortgage Market; FHFA; Fannie Mae; Freddie Mac
By: Scott Susin
Senior Economist
Division of Housing Mission and Goals
Office of Fair Lending Oversight
By: William D. Larson
Senior Economist
DIvision of Research and Statistics
Office of Economic Research
