How much is the land under a house worth? For researchers, this simple question has been difficult to answer for one main reason: for a typical residential property, the land and the house are purchased at the same time, for a single price.

A new FHFA working paper, authored by FHFA’s William Larson and Jessica Shui, along with Morris Davis (Rutgers), and Stephen Oliner (AEI and UCLA), sheds some light on this previously elusive question. The paper, "The Price of Residential Land for Counties, ZIP codes, and Census Tracts in the United States," measures the land price per acre by year for counties, ZIP codes, and census tracts in the U.S. by using over 16 million appraisals of single-family homes submitted to Fannie Mae and Freddie Mac between 2012 and 2018. Fannie Mae and Freddie Mac guarantee nearly 50 percent of mortgages in the U.S.
Previously, the most widely available land price information existed at the county or city level.
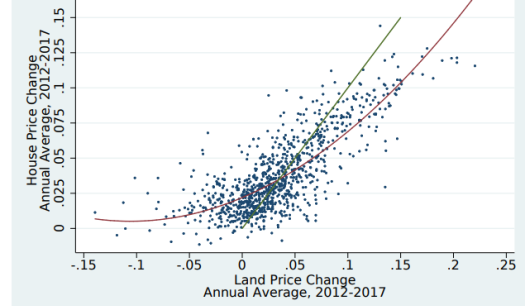
The new land price measures confirm what economists have long theorized — land prices decrease the further you get from the city center. The authors also found that from 2012 through 2017, land prices have, on average, been appreciating faster than house prices (pictured).
Later this year, the authors will update the series to include land share (the percentage of home value that is attributed to the land).
The paper and land price measures are available here.
Tagged: land prices; House Prices; real estate dynamics; collateral risk

By: William Larson
Senior Economist

By: Jessica Shui
Senior Economist