What happens to home values after a disaster? In a recent working paper, we address this question with a combination of readily available public data sources that track insurance claims and house prices. Focusing on a specific storm, Hurricane Ian, we use leading statistical estimation approaches, difference-in-differences (DiD) and synthetic control methods (SCM), to provide some insights. A key finding is that data limitations create problems for identifying precise price effects. This blogpost discusses the data, methodological choices, and basic findings.
As a preview, we find positive price effects for homes affected by the hurricane. However, our results should not be interpreted as causal, but more correlational. Several factors, including COVID-19 and measurement error, could have confounding influences which make it difficult to measure the effects of Ian’s damage on home prices. Still, the exercise is useful because it demonstrates how one might use public information and why it is useful to continue improving such data releases to support policy analyses.
Defining Damages from Hurricane Ian to Estimate Price Effects
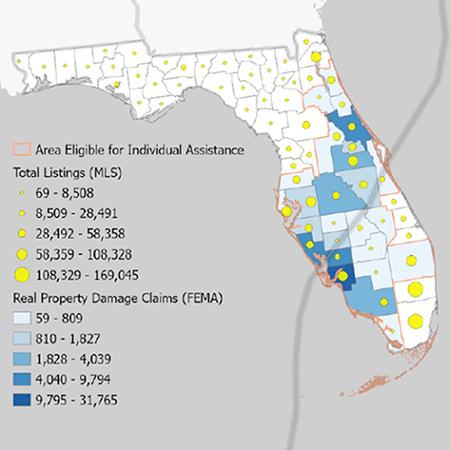
Hurricane Ian struck southwest Florida on September 23, 2022, damaging homes across the state. According to the National Hurricane Center Tropical Cyclone Report, Hurricane Ian “was responsible for over 150 direct and indirect deaths and over $112 billion in damage, making it the costliest hurricane in Florida’s history and the third costliest in the United States history”.1 Figure 1 shows that path of Ian through Florida. Real estate listings are shown with yellow dots (larger circles indicating counties with more properties for sale) and darker blue shading indicates places that had more claims filed for damages. The figure shows a large concentration of insurance claims in southwest Florida, which also has a large number of real estate listings. We focus on Lee County, which has the darkest shading and is located on the Gulf Coast side of the state where the storm first landed.
Figure 1: Hurricane Ian’s path through Florida in 2022
We estimate price effects by combining publicly available damages data with real estate listings data for southwest Florida between March 2015 and June 2023. The Federal Emergency Management Agency (FEMA) determines real property damage to properties for claims with limited or no insurance as part of the Individuals and Households Program (IHP). This information is combined with real estate market activity from Multiple Listing Service (MLS) data sourced by CoreLogic.
The key challenge we face is that many damage-related reports rely on publicly available disaster data, which for privacy reasons typically only include coarse descriptions of location. As a result, individual properties must be assigned damages from an aggregate level (e.g., county or ZIP code), thus introducing measurement error. This is a problem because previous research has shown mismeasured “treatment” variables like damages to a home can create problems for estimating causal price effects.2
After merging IHP and MLS data, treated areas are classified at the county or ZIP code levels and with each home in an area assigned the same treatment status. This occurs regardless of whether the home was damaged. We consider multiple ways to assign treatment at the county and ZIP code levels. While the full set of aggregate treatment definitions are shown in the paper, this blogpost only presents a preferred specification at the county level (with damages aggregated for all homes therein) where treatment indicates county damages exceed the median for other counties.
Preliminary Evidence
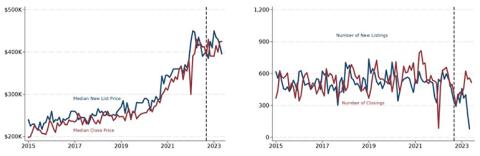
Real estate market measures are illustrated in two panels within Figure 2. While not shown here, the trends are similar between Lee County (the focus area) and the entire state of Florida. The left panel presents median list (solid navy line) and close prices (solid maroon line) for each month during our sample. Both price trends are noisy and lack a sharp change when the storm hit, which is denoted by the dashed vertical black line. The right panel shows a reduction in the number of new listings, suggesting that prices could have been propped up by a decrease in home supply. Alternatively, homes that sold after the storm could be disproportionately better quality and command a premium. We are agnostic about the correct channel at work here: more careful analysis is needed to identify the mechanism(s) operating to affect prices. Finally, a potential COVID-19 effect starts after 2020 with prices increasing more quickly in the left panel and greater listing volatility in the right panel.
The lack of a clear and sustained impact on home prices suggests a more rigorous empirical analysis is needed for prices. We emphasize that we do not claim to establish a causal relationship nor that a price adjustment mechanism is identified correctly. We simply aim to estimate any aggregate price effect while using public data and documenting the challenges even when using leading statistical approaches.
Figure 2: Real estate market activity in Lee County, Florida
Difference-in-Differences Method for Price Effects
The most common approach used in the disaster literature for estimating price effects is a difference-in-differences (DiD) or event study approach.3 In generalized terms, this means comparing price trends in affected (“treated”) areas with price trends in unaffected (“control”) areas.
Figure 3: Dynamic DiD for Lee County where Hurricane Ian made landfall
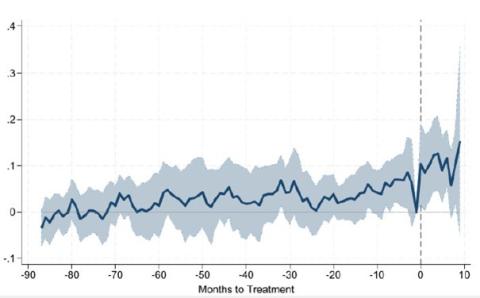
Figure 3 conveys the DiD results for a dynamic treatment (“event study”). The horizontal axis represents time relative to Ian, with the vertical dashed line indicating Ian’s landfall. The vertical axis shows an estimated parameter that is the difference in price trends between affected and unaffected areas at each time, with the shaded area representing the 95% confidence interval of the parameter. Higher prices are correlated with damages post-Ian. Where is this shown? By the price trend increasing above the zero line after the dashed vertical line.
However, the key assumption underlying DiD is the parallel trends assumption, which says that absent Hurricane Ian the areas affected and not affected would have had similar price trends. To test whether this assumption holds, researchers commonly conduct “pre-trends” tests, checking whether before Ian affected and not affected areas had similar price trends. In Figure 3, this corresponds to the difference in price trends being close to zero prior to the dashed line. As the figure shows, there is evidence that parallel trends does appear to be violated about 20 to 25 months prior to Ian’s arrival. What happened at that time? That was the early period of COVID. This is problematic statistically because the homes that saw prices increase during the early stages of the pandemic were the same homes that were damaged by Ian, making identification of the true Ian price effects challenging.
Synthetic Control Method for Price Effects
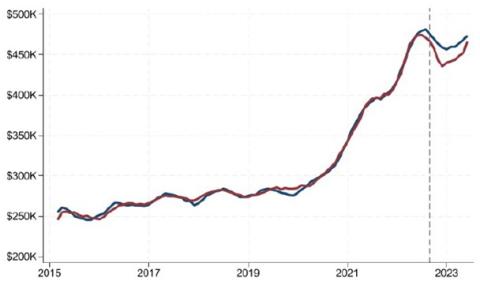
Another approach one can take is to construct a suitable control using the synthetic control method (SCM) at the aggregated level. The SCM determines an optimal weighted average of untreated counties (i.e. its synthetic control) to match the pre-Ian price trends of Lee County. Figure 4 below illustrates Lee County and its synthetic control. The figure suggests a time-varying price premium of at least five percent that peaks in the low double digits a few months after Ian, similar to the DiD finding. However, despite the apparent good fit in the figure with the blue and red lines appearing to be on top of each other until the dashed vertical line, more sensitive goodness of fit tests indicate these estimates lack statistical significance.
Figure 4: Synthetic control for Lee County
Conclusion
In summary, using publicly available data it may be difficult to estimate price effects even when employing leading empirical techniques. While we record some evidence for positive price effects for Ian, it is possible that declines across many markets but less so in the target county. Either way, these results should be viewed with some skepticism because of an inability to establishing actual property-level damages when using public data. Given the local nature of damages, when one is unable to precisely identify which units are treated or not, finding a suitable control group is extremely difficult. For those interested in working with such data, we offer several suggestions in the paper and encourage you to read further.
1 See https://www.nhc.noaa.gov/data/tcr/AL092022_Ian.pdf.
2 For recent academic research on this type of problem in a difference-in-differences setting, see Denteh Kedagni (2022) and Negi Negi (2022), for example. The problem is the mismeasurement of the treatment variable, often called a “misclassification” problem.
3 See another one of FHFA’s working papers, for a recent review of the applied disaster literature: Justin Contat, Carrie Hopkins, Luis Mejia, Matthew Suandi. 2024. “When Climate Meets Real Estate: A Survey of the Literature." Real Estate Economics. https://doi.org/10.1111/1540-6229.12489.
By:Justin Contat
Senior Economist
Division of Research and Statistics
By:Will Doerner
Supervisory Economist
Division of Research and Statistics
By:Robert Renner
Senior Geographer
Division of Research and Statistics
By:Malcolm Rogers
Economist
Division of Research and Statistics
Tagged: FHFA Stats Blog; Source: FHFA; Natural Disasters; Natural Disaster Price Effects; hurricane; real estate valuation